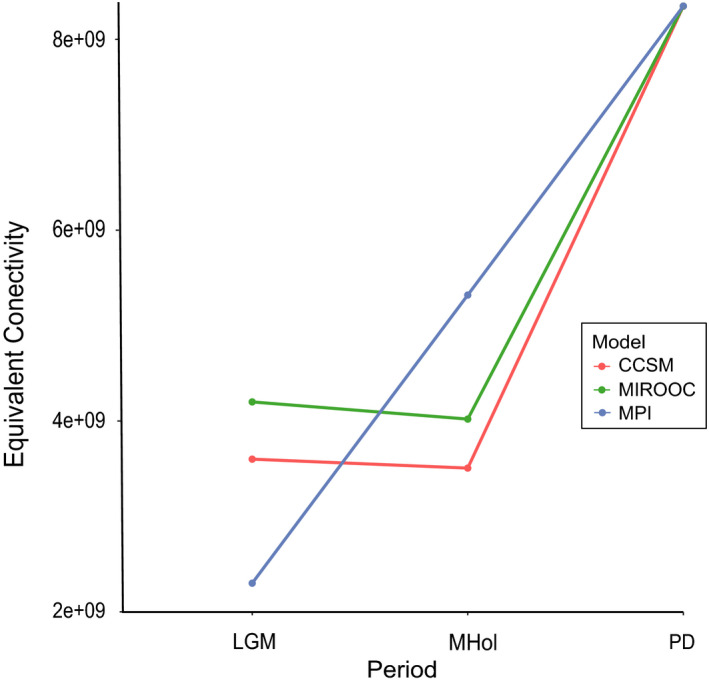
FIGURE 6.

Equivalent connectivity area (ECA) in m2 for three periods: LGM (~21 ka), MHol (~11 ka), and PD (present day) and three global climate models (CCSM4, MIROC‐ESM, and MPI). This connectivity index calculates the area of a single patch with maximum connectivity that would reflect the same connectivity value as the observed landscape
