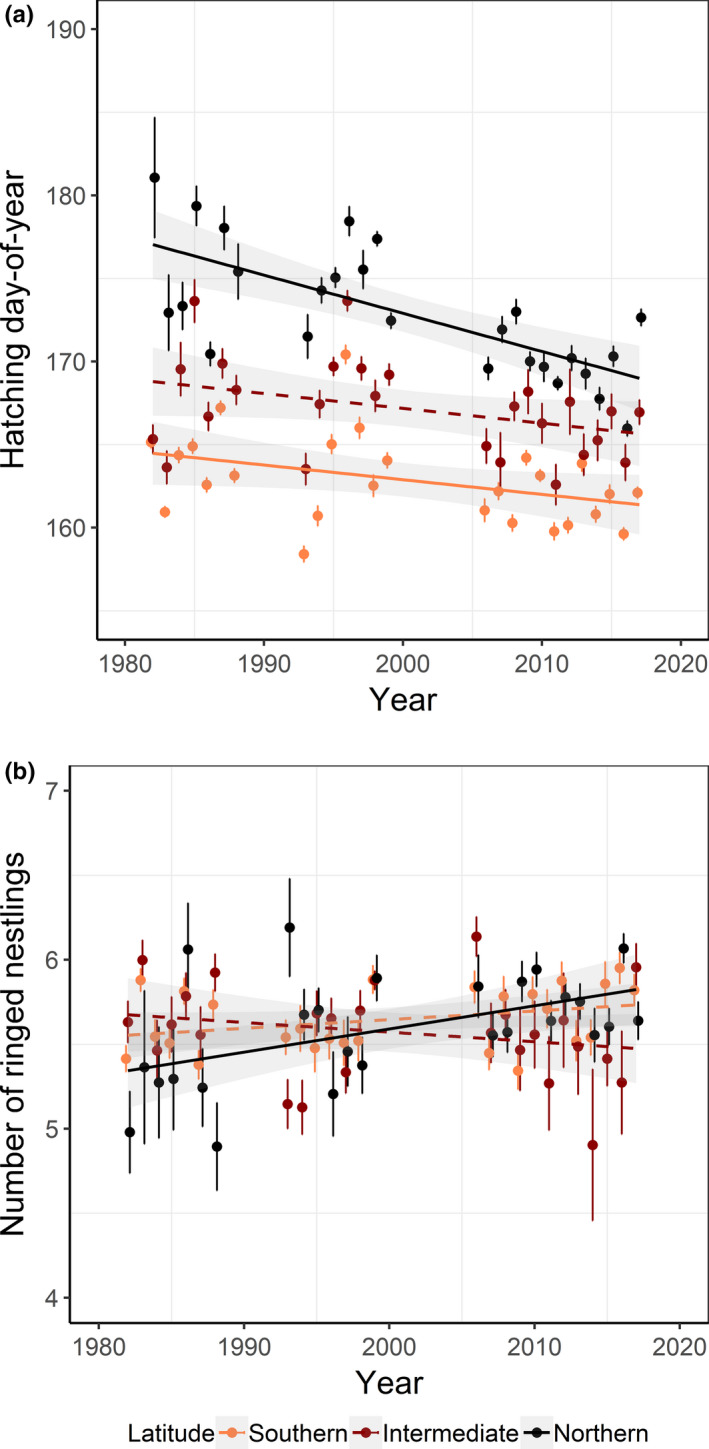
FIGURE 5.

Breeding time (a) and breeding success (b), measured as hatching day‐of‐year and number of ringed nestlings, respectively. Annual averages for pied flycatchers breeding in Sweden during 1982–2017 split by three latitudinal bands. Linear regressions with p ≤ .05 (solid lines) and p > .05 (dashed lines), standard errors (bars), and confidence intervals (shaded) are shown
