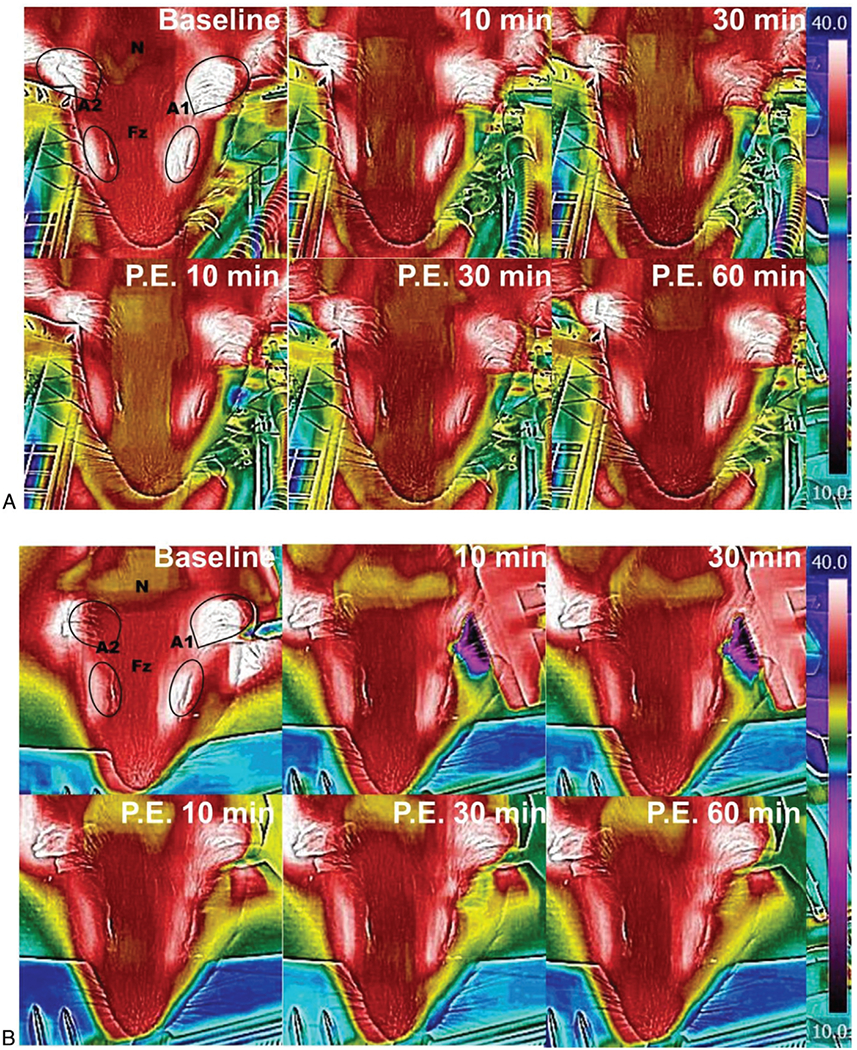
FIG. 1.

Thermography demonstrates cooling of the targeted ear. Figure 1 shows the thermal distribution on the guinea pig head from time 0 (before cooling) to 60 minutes after discontinuation of cooling with water (A) or ear bar (B). The black lines show the contours of the guinea pig anatomy. The ears are outlined and white in color, the eyes are also white and marked by ovals. The temperature was measured at the frontal portion (Fz) of the skull (at midline between the superior portion of the eye), the anterior portion of the left ear pinna (A1), the anterior portion of the right ear pinna (A2), and nape (N) of the neck. Temperature transference was not limited to the treated ear, but did appear localized to the head, and generally took at least 60 minutes to return to baseline temperature.
