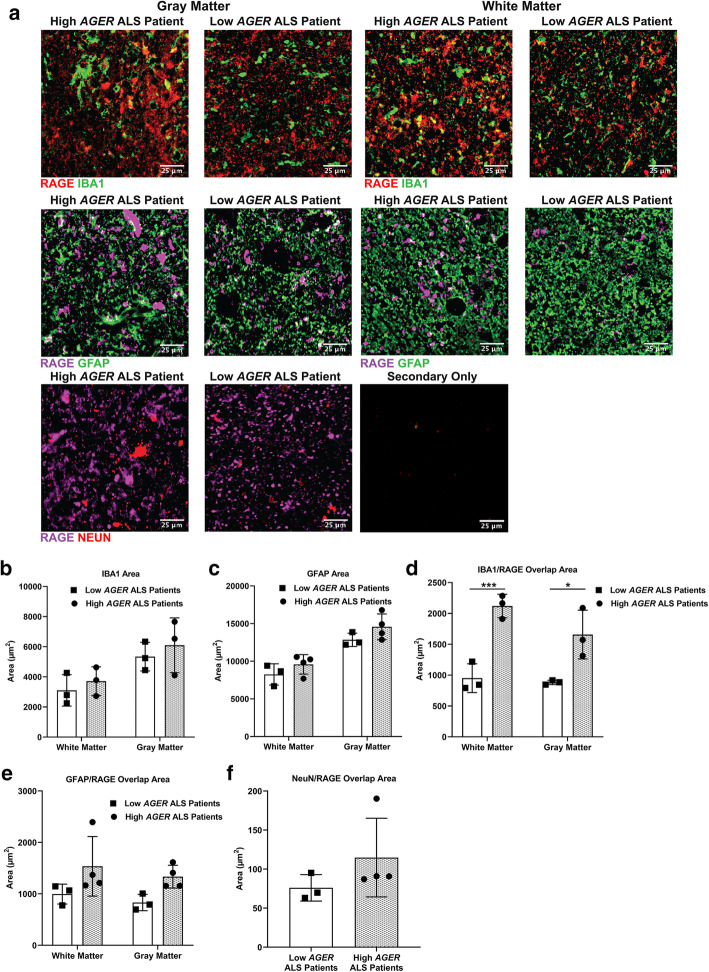
Fig. 2.
AGER expression changes coincide with alterations in overlap of microglia and RAGE protein. a Representative images of regions of interest for RAGE, IBA1, GFAP, and NeuN staining in the ventral horn of high and low AGER patient cervical spinal cord and anterior white matter. Scale bar: 25 μm. b Quantification of IBA1+ area. c Quantification of GFAP+ area. d Quantification of overlap of IBA1+ RAGE+ area. e Quantification of overlap of GFAP+ RAGE+ area. f Quantification of overlap of NeuN+ RAGE+ area. N = 4 high AGER patients and N = 3 low AGER patients. Mean ± SD. In b–e: two-way ANOVA with post-hoc Tukey’s test. In f: Mann-Whitney U test. *p = 0.0102, ***p = 0.0009

