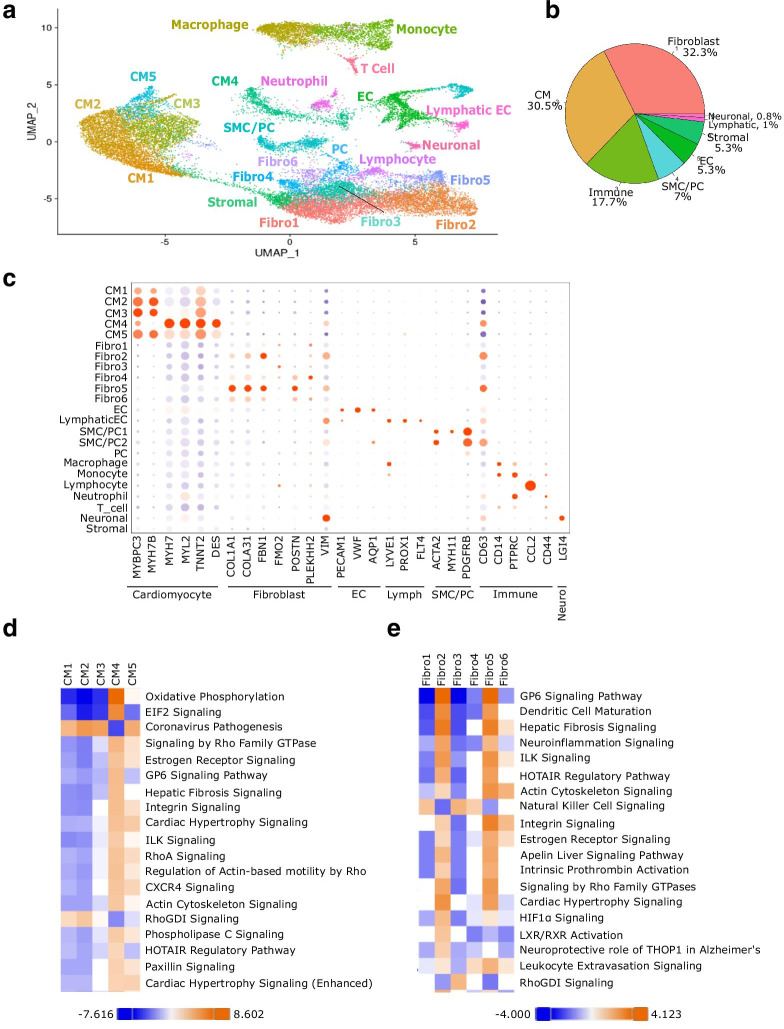
Fig. 4.
Single nuclei RNA-sequencing reveals cellular diversity within the adult human IVS. a UMAP of the integrated dataset overlayed with cell type assignment for each cluster. b Distribution of cell types in the adult human IVS. Similar cell types were grouped together. c Dotplot of different biomarker expression across all the cell types. The size of the dot indicates the percentage of cells within that cluster expressing that gene, and the color indicates the normalized level of expression. d Qiagen Ingenuity Pathway comparison heatmap of the top canonical pathways across the five cardiomyocyte populations within the IVS. e Qiagen Ingenuity Pathway comparison heatmap of the top canonical pathways across the six fibroblast populations within the IVS

