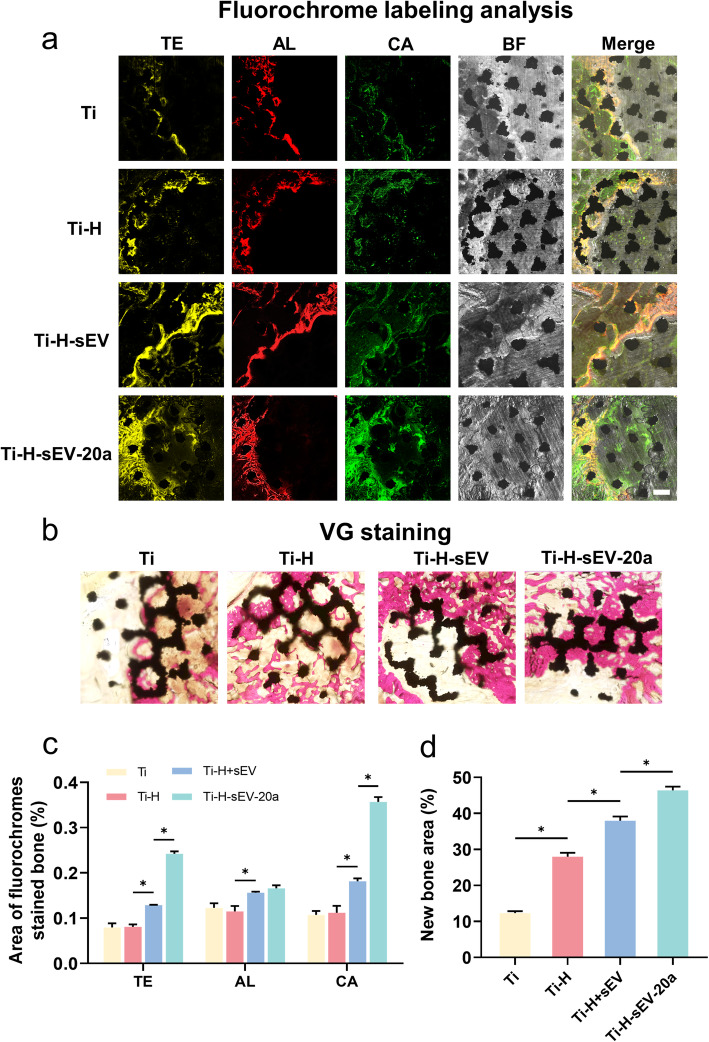
Fig. 6.
Ti-H-sEV-20a enhanced the osteointegration evaluated by histology in vivo. a The osteointegration results were shown by fluorochrome labeling analysis. The images showing yellow (TE), red (AL), green (CA) and bright filed (BF) were photographed by laser confocal microscopy. b The undecalcified specimens were stained with van Gieson’s picrofuchsin. Red area represented newly regenerated bone. Scale bar = 500 μm c TE, AL and CA staining area were assessed by statistical analysis. Scale bar = 500 μm. d The quantitative analysis of new bone formation by VG staining was calculated by Image J. (n = 6, * p< 0.05, the magnification was 40×)

