Fig. 4.
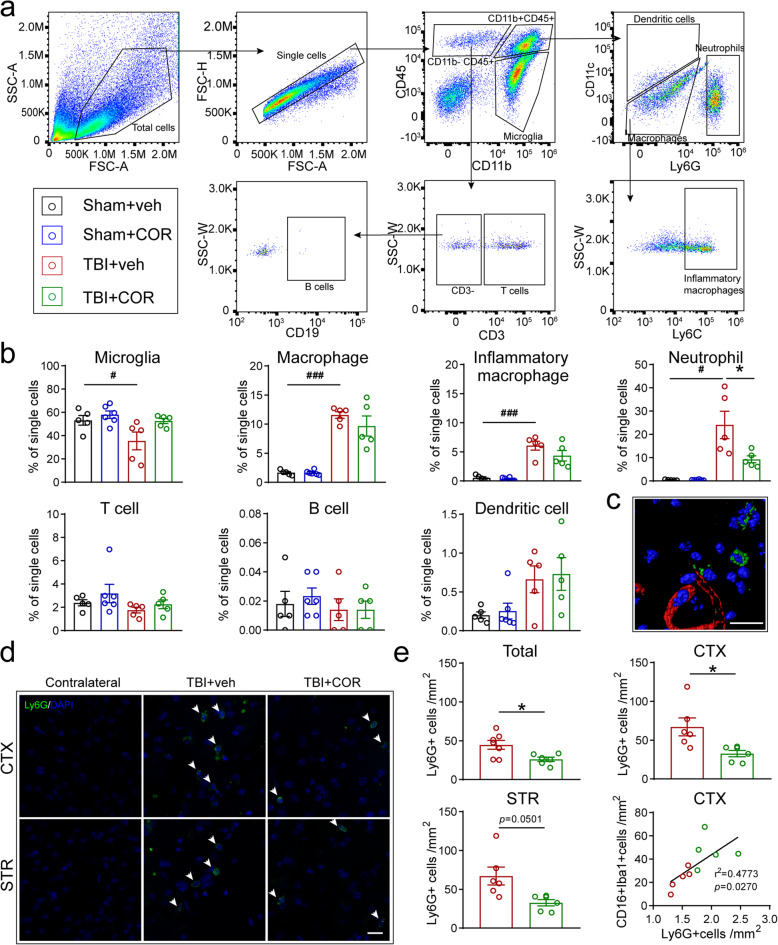
Effect of cordycepin on peripheral immune cell infiltration. a Illustration of flow cytometry analysis of circulating immune cells in the brain on 3 days after TBI. b Quantification of the numbers of infiltrating immune cells to the brain. n=5/group. c 3D-reconstructed image of confocal pictures of Ly6G/tomato-lectin straining. Scale bar: 20 μm. d Representative images of Ly6G straining. White arrows indicate Ly6G+cells. Scale bar: 20 μm. e Quantification of numbers of total Ly6G+cells and Ly6G+cells in CTX and STR, n=6/group. And correlation analysis of Ly6G+cells and CD16+Iba1+cells. n=5/group. #p < 0.05, ###p < 0.001, or *p < 0.05 as indicated

