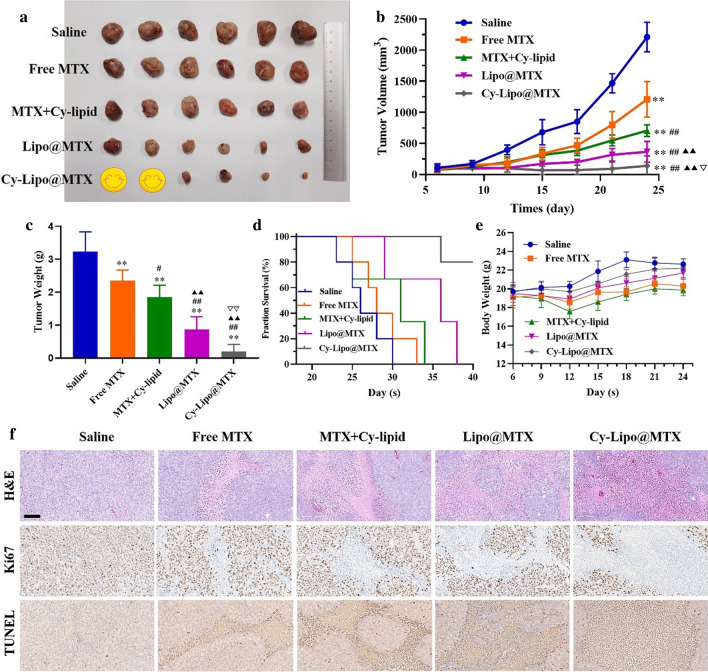
Fig. 11.
The tumor photographs on the day 24 (a). Tumor volume curves after intravenous injection of saline or MTX preparations (5 mg MTX-equivalent/kg body weight) from sixth day (n = 6) (b). Tumor weight of each group on day 24 (c). Kaplan–Meier survival curves of choriocarcinoma tumor-bearing mice treated with saline or MTX formulations (n = 5) (d). Mean body weight of the mice in different groups during the treatment (n = 6) (e). The H&E, Ki67, and TUNEL staining images of tumor tissues indicating the tissue necrosis, cell proliferation and cell apoptosis (f), scale bar is 100 µm. *P < 0.05, **P < 0.01, vs saline group. ##P < 0.01, vs free MTX treated group. ▲▲P < 0.01, vs MTX + Cy-lipid treated group. ▽P < 0.05, ▽▽P < 0.05, vs Lipo@MTX treated group

