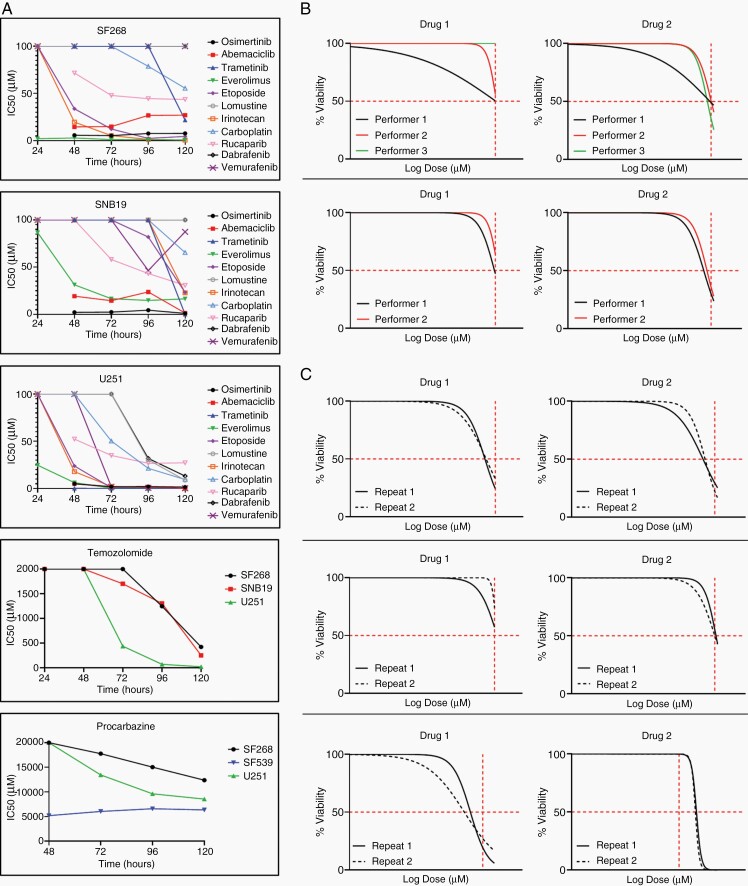
Figure 1.
(A) Timing of optimal drug response prediction in 3 HGG cell lines. (B,C) Representative data of inter- and intra-assay reproducibility testing. Reproducibility was defined as having similar drug response readouts indicated by the vertical red hash lines in the graphs. (B) Overlapping nonlinear regression curves of assay generated drug response performed by multiple operators on 2 primary tissue samples and 2 drugs. (C) Repetition of assay generated drug response by a single operator for 3 different primary tissue samples and 2 drugs each. n = 7.

