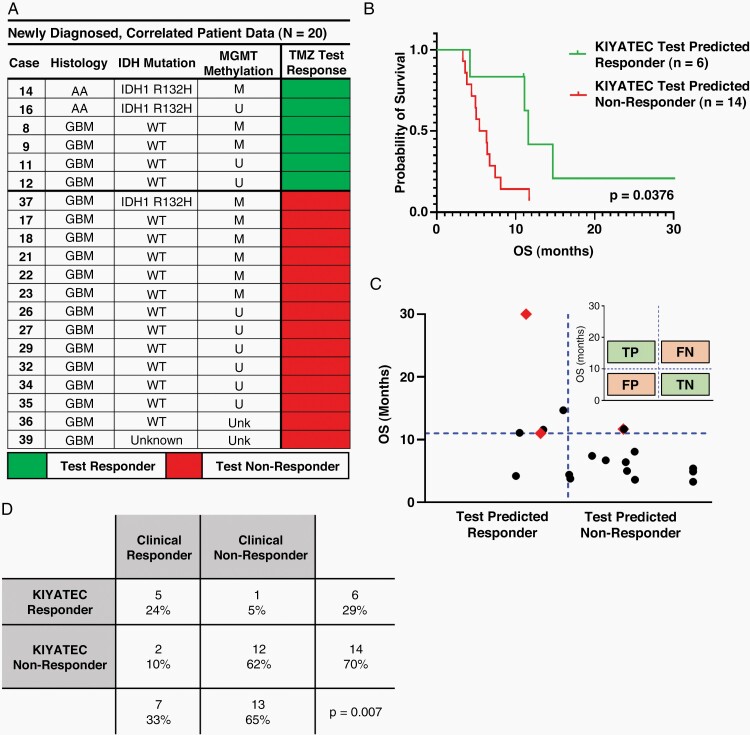
Figure 4.
(A) Summary of the 20 patients whose TMZ test prediction data were correlated to clinical response. (B) Kaplan–Meier plot of the 20 patients who progressed enough to make a call on assay prediction following initial surgery separated by assay defined TMZ response. (C) Scatter plot of patients analyzed within this cohort. Red diamonds indicate the 4 patients who have progressed enough to assess assay prediction of OS but are still alive. The inset defines the parameters for categorizing patients as true positive (TP), true negative (TN), false positive (FP), and false negative (FN) according to both assay response and clinical response. (D) Contingency table of response cohorts based upon assay defined TMZ response.

