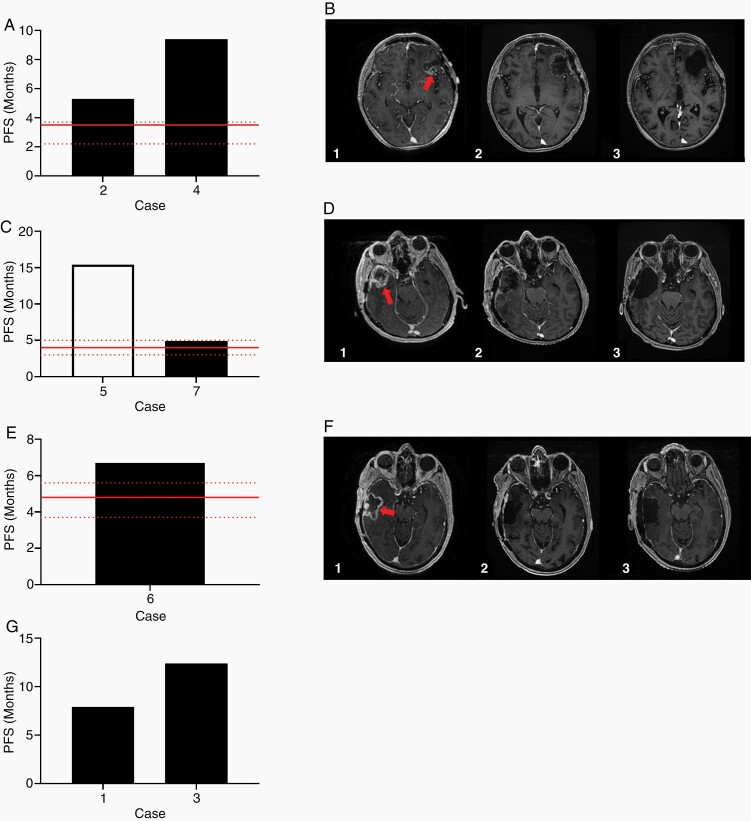
Figure 6.
(A) PFS of the patients treated with combination carboplatin/bevacizumab. Red line indicates published median PFS and 95% CI for patients treated with carboplatin/bevacizumab combination therapy. (B) MRI of the brain of one patient treated with carboplatin/bevacizumab combination therapy. T1 weighted contrasted axial images immediately preceding the patient’s third resection (1) showing enhancing nodularity (arrow) within the prior resection cavity, immediately following the third resection (2), and after 6 cycles of carboplatin/bevacizumab (3) with no evidence of enhancing disease in the cavity. (C) PFS of the patients treated with combination carboplatin/etoposide. Red line indicates published median PFS and 95% CI for patients treated with carboplatin/etoposide combination therapy. The white bar indicates that at the time of this publication, the patient has not progressed. (D) MRI of the brain of one patient treated with carboplatin/etoposide combination therapy. T1 weighted contrasted axial images immediately preceding the patient’s second resection (1) with bulky recurrent enhancing disease (arrow), immediately following the second resection (2), and after 6 cycles of carboplatin/etoposide (3) with no evidence of enhancing disease. (E) PFS of the patient treated with combination irinotecan/bevacizumab. Red line indicates published median PFS and 95% CI for patients treated with irinotecan/bevacizumab combination therapy. (F) MRI of the brain of the patient treated with irinotecan/bevacizumab combination therapy. T1 weighted contrasted axial images immediately preceding the patient’s second resection (1) showing enhancing area of recurrence (arrow), immediately following the second resection (2), and after 5 cycles of irinotecan/bevacizumab (3) without evidence of progressive disease. (G) PFS of the patients treated with dabrafenib.

