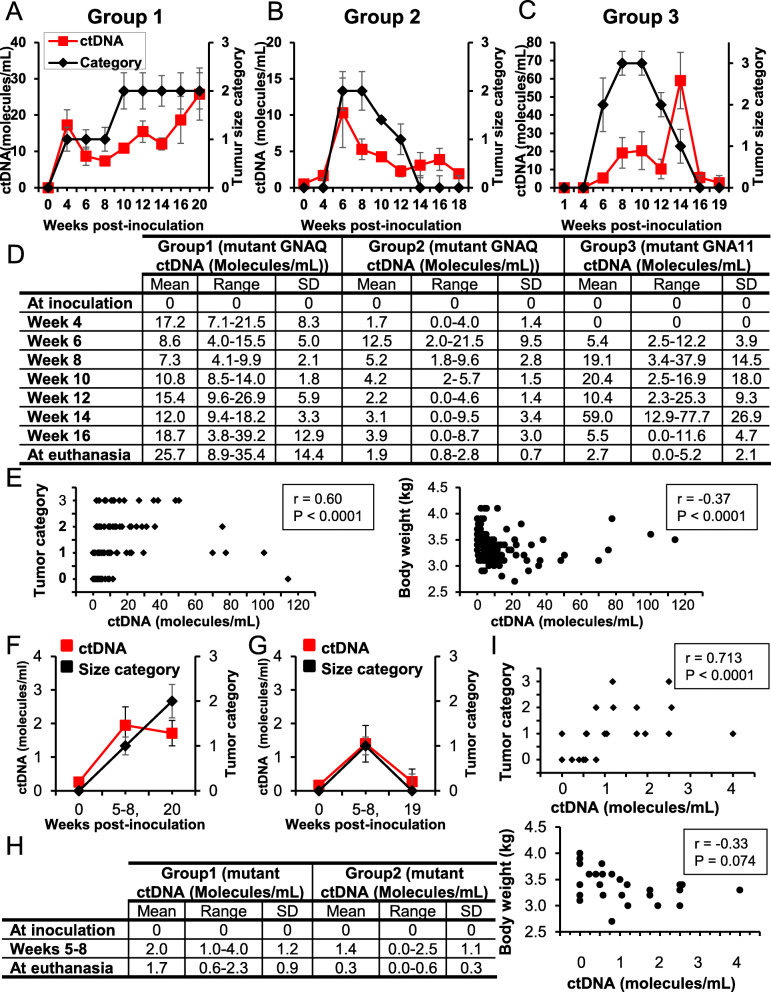
Fig. 3.
Mutated ctDNA plasma and aqueous humor levels mirrored the pattern of intraocular disease behavior in rabbits. A-C. Kinetics of the levels of mutated ctDNA in rabbit plasma (left Y-axis) and tumor size categories (right Y-axis) following ocular inoculation of 92.1 cells (A and B; Groups 1 and 2) or MP41 cells (C; Group 3). The legend for all panels is shown on the top A panel. D. Table shows the number of ctDNA molecules/mL in rabbit plasma at inoculation (week 0), weeks: 4, 6, 8, 10, 12, 14, 16, and at euthanasia. E. Mutated plasma ctDNA levels were plotted against tumor size categories (left panel) or rabbit body weight (right panel). Significant positive or negative correlations were found between ctDNA levels and size categories (r = 0.60, P < 0.0001) or body weight (r = − 37, P < 0.0001). F-G. Kinetics of the levels of mutated ctDNA in rabbit aqueous humor (left Y-axis), and tumor size categories (Cat) (right Y-axis) in animals inoculated with 92.1 cells (F. Group 1, G. Group 2). H. Table shows ctDNA molecules/mL from aqueous humor at inoculation, weeks 5–8, and euthanasia. I. Top panel: Mutated ctDNA aqueous humor levels were plotted against tumor size categories, which displayed a significant positive correlation (r = 0.713, P < 0.0011). Bottom panel: Mutated ctDNA levels were plotted against rabbit body weight; no correlation was found (r = − 0.33, P = 0.074). SD: Standard deviation

