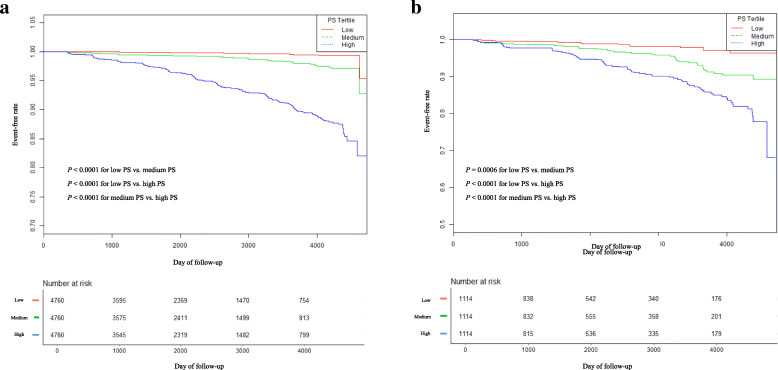
Fig. 3.
Kaplan–Meier event-free survival curve based on propensity score tertile. a Kaplan–Meier analysis of incident diabetes based on propensity score (PS) tertile in the original cohort (log-rank, P < 0.0001). P values were calculated for each pair of two groups (total three comparisons: Low PS vs. Medium PS, Low PS vs. High PS, Medium PS vs. High PS) with Bonferroni correction. b Kaplan–Meier analysis of incident diabetes based on propensity score (PS) tertile in the propensity score matching cohort (log-rank, P < 0.0001). P values were calculated for each pair of two groups (total three comparisons: Low PS vs. Medium PS, Low PS vs. High PS, Medium PS vs. High PS) with Bonferroni correction

