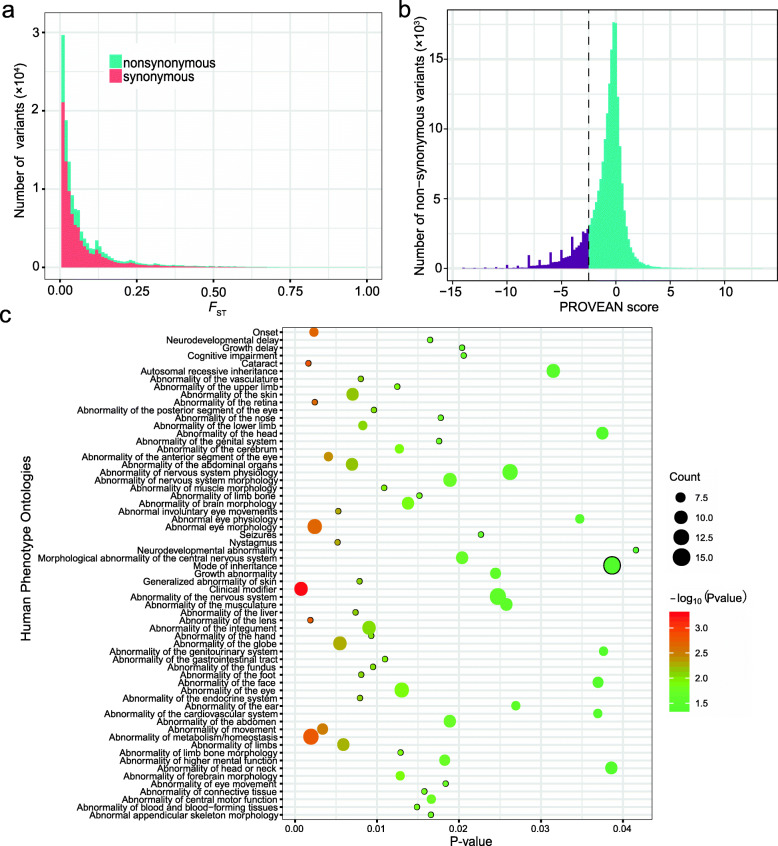
Fig. 2.
The distribution and functional enrichment analyses of high-impact mutations. a Distribution of pairwise FST between domestic chickens and GGS for non-synonymous and synonymous mutations (stacked on the plot). b Distribution of the effects of variants predicted by PROVEAN. The more negative the score is, the more likely the variant impacts protein function. The PROVEAN score threshold used in this study is drawn as a vertical dashed line (score ≤ −2.5). c HPO analysis of genes carrying alleles with PROVEAN score < −10. P-values were corrected using Benjamini-Hochberg FDR. Count depicts the number of genes for each category. We only show HPO terms with more than six enriched genes

