
Figure 2.
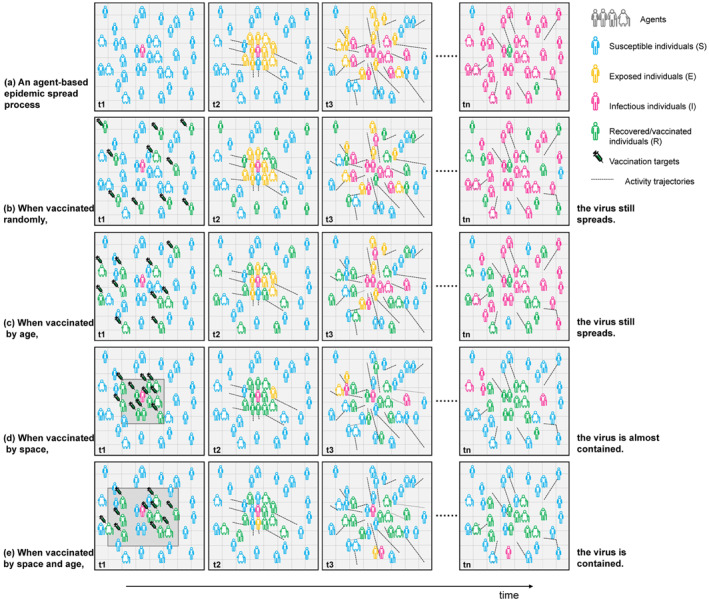
Schematic diagram of agent‐based simulation. A simplified agent‐based simulation diagram is displayed. The horizontal axis represents time, and the vertical axis represents different scenarios. A completely natural epidemic transmission process without any intervention measures (a), different vaccine intervention strategies on epidemic spreading process (b–e).