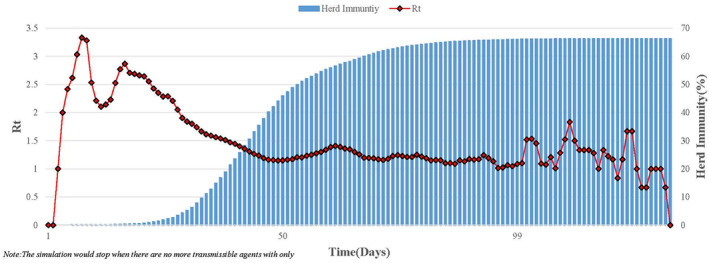
Figure 3.

The variation of and herd immunity over time ( = 3) in Scenario 1. This simulates a completely natural transmission without any intervention measures under = 3, assuming that all agents are equally susceptible, and equally infectious. Red line represents actual time‐dependent variation of . Blue columns represents herd immunity. The whole simulation represents 150 days.
