
Figure 5.
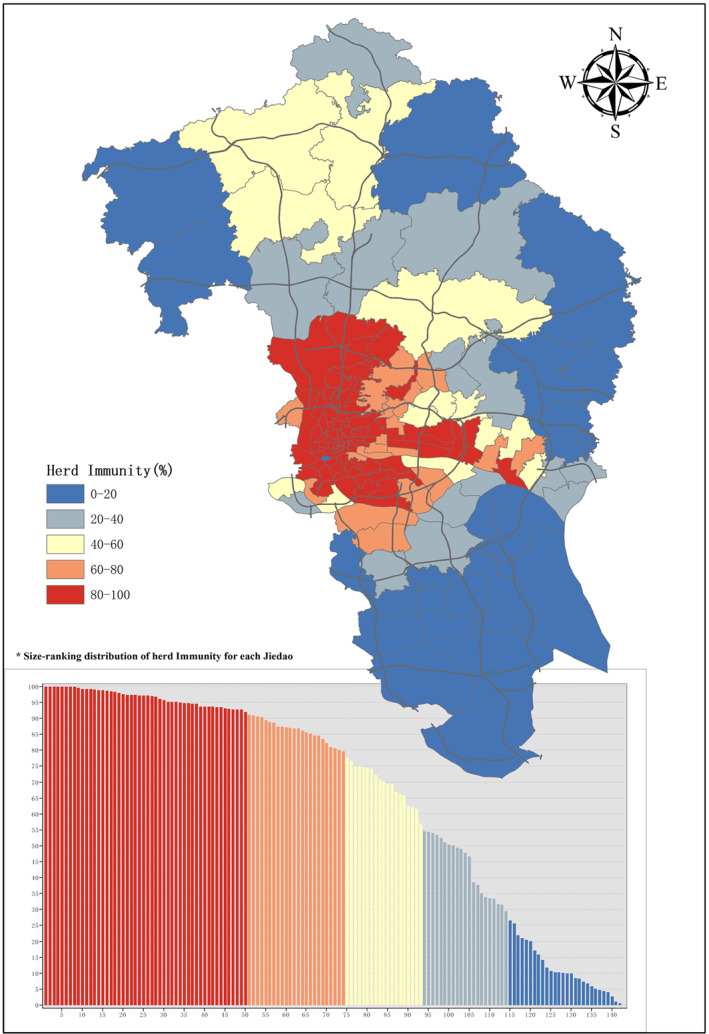
Spatial distribution of Herd Immunity at Jiedao Level from Scenario 2. The scenario simulation would stop when there are no more transmissible agents with only susceptible and removed agents remaining in the procedure. At the point, herd immunity would be achieved. The herd immunity rate of each Jiedao are displayed in colors. In the bottom left, it is displayed in descending order of herd immunity rate from left to right.