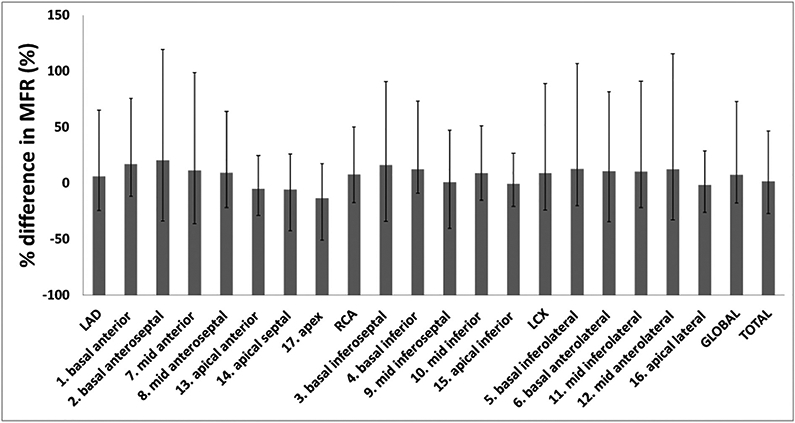
Fig. 2.

Average percent difference in MFR between the follow-up and baseline 13N-PET studies for the three major territories and 17 myocardial segments. Error bars refer to maximum and minimum corresponding values within the cohort. MFR was calculated after normalizing rest and stress MBF to the corresponding RPP. MFR: Myocardial Flow Rate; MBF: Myocardial Blood Flow; RPP: Heart Rate-Blood Pressure Product.
