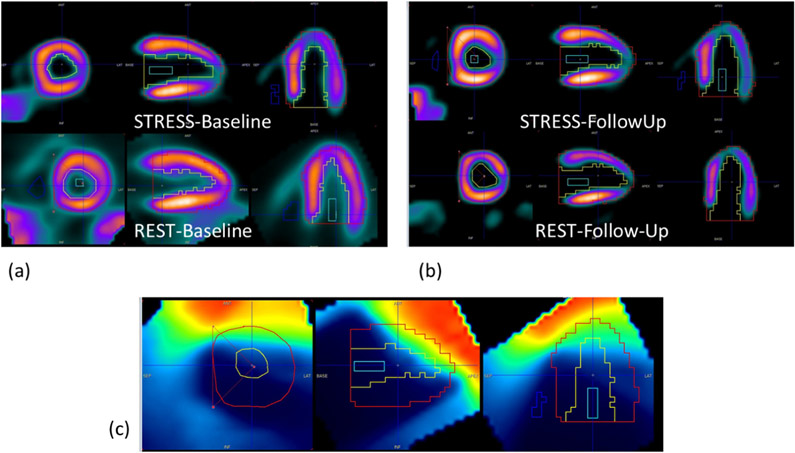
Fig. 4.
Stress and rest 13N-Ammonia PET images at (a) baseline and (b) 350 days post- radiotherapy. The left ventricular myocardial VOI is overlaid onto (c) the RT dose map, re-oriented into cardiac position. The mean dose delivered by radiotherapy was measured for the whole myocardium, the three coronary territories, as well as for each of the 17 segments.

