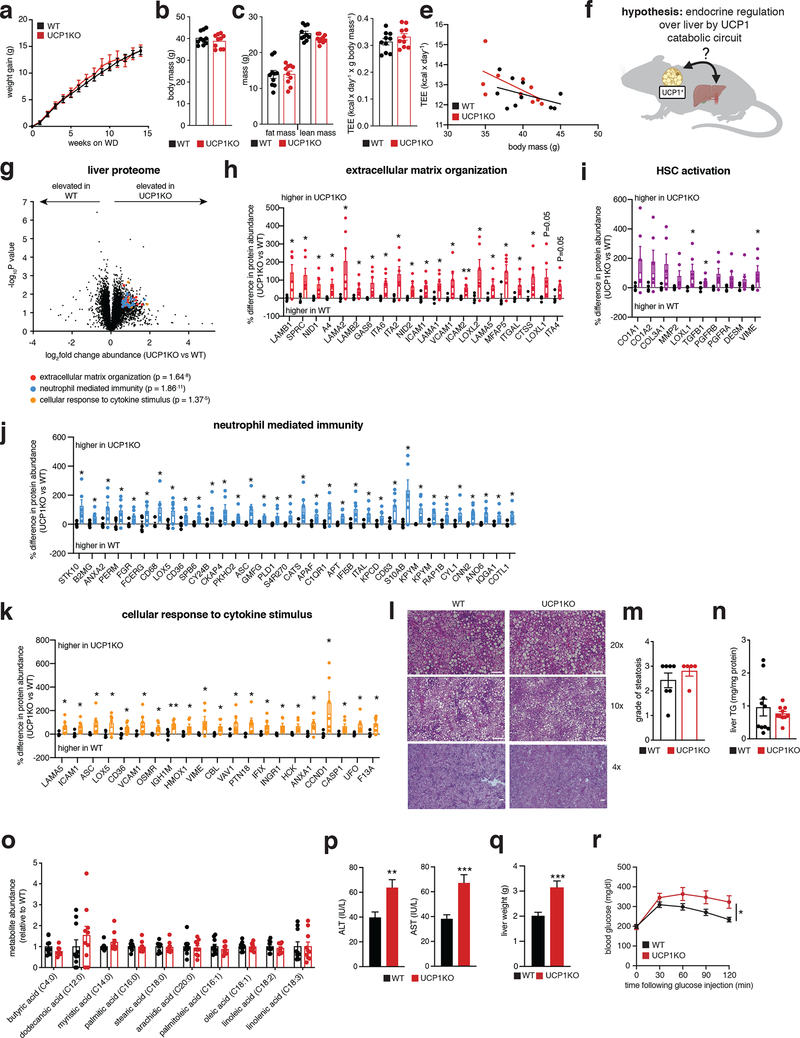
Figure 1: Brown and beige adipose tissues regulate systemic inflammation and liver pathology independent of thermogenesis.
a, b, Change in body mass (a) and final weight (b) during WD feeding (n = 10)
c, Body composition of mice following 14 weeks WD feeding (n = 10).
d, e, Cumulative whole body energy expenditure of mice over 14 weeks WD feeding, determined as described in Methods (n = 10).
f, Hypothesis for thermogenesis-independent role for the BAT UCP1 catabolic circuit in endocrine regulation over liver.
g, Protein abundance differences between WT and UCP1KO liver following 14 weeks WD feeding. Top pathways enriched in proteins exhibiting > 50% increase between genotypes highlighted; (WT n = 5; UCP1KO n = 6).
h-k, Protein abundance differences of top enriched pathways (h, j, k) or established HSC activation proteins (i) between WT and UCP1KO liver following 14 weeks WD feeding; (WT n = 5; UCP1KO n = 6).
l, Representative images of hematoxylin and eosin staining of liver harvested from mice following 14 weeks WD feeding (upper panels 20x magnification, scale bars 100 μm; middle panels, 10x magnification, scale bars 200 μm, lower panels, 4x magnification, scale bars 200 μm; n = 7 (WT); n = 5 (UCP1KO, SUCNR1KO/UCP1KO) biological replicates/genotype imaged).
m, Steatosis grade following 14 weeks WD feeding (WT n = 7; UCP1KO n = 5). See methods for grading system.
n, Liver triglyceride (TG) content following 14 weeks WD feeding (n = 10).
o, Relative abundance of lipid metabolites in liver following 14 weeks on WD (n = 10).
p, Levels of ALT (left) and AST (right) in WT and UCP1KO plasma following 14 weeks WD feeding (ALT: WT n = 41; UCP1KO n = 34; AST: WT n = 37; UCP1KO n = 33).
q, Liver weights of WT and UCP1KO mice following 14 weeks WD feeding (WT n = 20; UCP1KO n = 14).
r, i.p. glucose tolerance test in mice following 14 weeks WD feeding (WT n = 24; UCP1KO n = 15).
*P < 0.05, **P<0.01, ***P<0.001 (two-tailed Student’s t-test for pairwise comparisons, two-way ANOVA for multiple comparisons involving two independent variables, ANCOVA for e). Data are mean ± s.e.m. See source data for precise p values.

