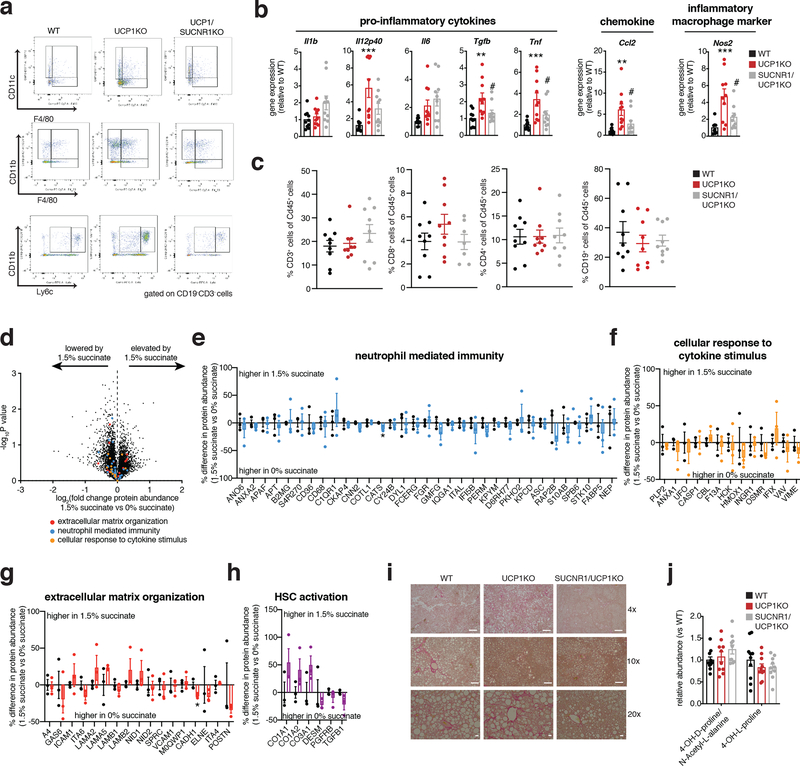
Extended Data Figure 5: Assessment of UCP1/SUCNR1KO during WD and succinate drinking water experiments.
a, Representative cytofluorimetric dot plots for indicated immune cell populations from livers of WT, UCP1KO and UCP1/SUCNR1KO mice following 14 weeks on WD.
b, Relative gene expression in WT, UCP1KO, and UCP1/SUCNR1KO livers following 14 weeks WD feeding (n = 10 except Il6, Nos2 n = 9 in WT and Nos2 n = 9 in UCP1/SUCNR1KO).
c, Fraction of CD45+ cells for each indicated gated cell population from livers of WT, UCP1KO and UCP1/SUCNR1KO mice following 14 weeks on WD (n = 9 except CD8 n = 7 in UCP1/SUCNR1KO).
d-h, Protein abundance differences of annotated pathways proteins or HSC activation proteins between vehicle and 1.5% succinate-treated UCP1KO liver following 6 weeks HFD (n = 3). Data represent fold over 0%.
i, Sirius red staining observed in liver harvested from mice following 14 weeks WD feeding (upper panels 20x magnification, scale bars 100 μm; middle panels, 10x magnification, scale bars 200 μm, lower panels, 4x magnification, scale bars 200 μm; n = 4 biological replicates/genotype imaged).
j, Relative abundance of hydroxyproline in plasma following 14 weeks on WD WT (n = 10).
*P < 0.05, **P<0.01, ***P<0.001. (two-tailed Student’s t-test for pairwise comparisons, one-way ANOVA for multiple comparisons involving independent variable). Data are mean ± s.e.m. Assessments of UCP1/SUCNR1KO mice were performed simultaneously with WT and UCP1KO as depicted in Figure 2 and Extended Data Figure 2, so WT and UCP1KO presentations in this figure are from the same underlying data reported in Figure 2 and Extended Data Figure 2. See source data for precise p values.

