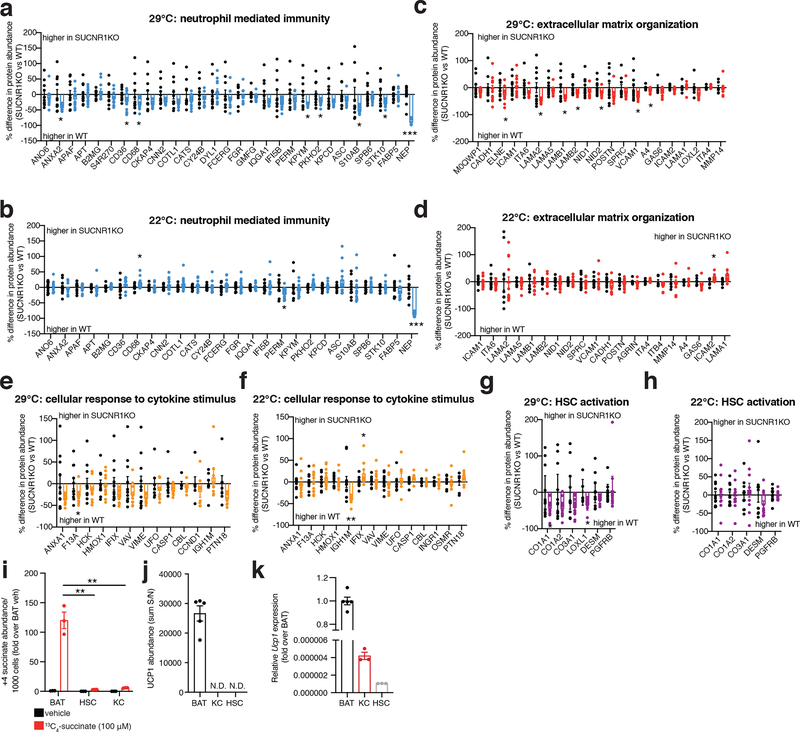
Extended Data Figure 8: SUCNR1 ablation limits WD-induced inflammatory and ECM remodelling protein abundance at thermoneutrality but not at room temperature.
a-h, Protein abundance differences of annotated pathways proteins between WT and SUCNR1KO liver following 14 weeks WD feeding at thermoneutrality (a, c, e, g) or room temperature (b, d, f, h). (WT n = 10–11, SUCNR1KO n = 10–12; except A4, GAS6, ICAM2, LAMA1, LOXL2, ITA4, MMP14, WT n = 5–7, SUCNR1KO n = 8). Data represent fold over WT at each temperature. Illustrated proteins are from top pathways found to be enriched in proteins exhibiting > 50% increase between WT and UCP1KO in Figure 2.
i, 13C4-succinate uptake into brown adipocytes, KC and HSCs following 2 min incubation with 13C4-succinate (100 μM). Data represent relative signal normalized to cell number (n = 3). Data represent fold over brown adipocytes vehicle.
j, UCP1 protein abundance (sum signal to noise ratio) in BAT, KC and HSCs (BAT n = 5; KC, HSC n = 3).
k, Relative Ucp1 expression in BAT, KC and HSCs (BAT n = 5; KC, HSC n = 3). Data represent fold over BAT.
*P < 0.05, **P<0.01, ***P<0.001. (two-tailed Student’s t-test for pairwise comparisons). Data are mean ± s.e.m. See source data for precise p values.

