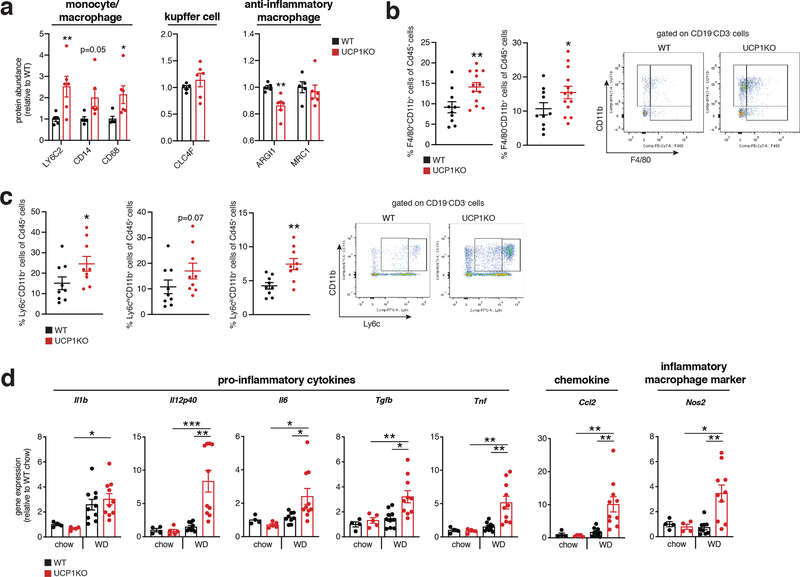
Figure 2: The UCP1 catabolic circuit controls inflammation and myeloid cell populations in the liver.
a, Protein abundance differences between WT and UCP1KO liver immune cell markers following 14 weeks WD feeding (WT n = 5; UCP1KO n = 6).
b, c, Cytofluorimetric dot plots (right) and fraction of CD45+ cells for each indicated population (left) from livers of WT and UCP1KO mice following 14 weeks on WD (b: WT n = 10; UCP1KO n = 13; c: n = 9).
d, Relative gene expression of cytokine, chemokine, and macrophage markers in WT and UCP1KO livers following 14 weeks WD (n = 10 except Il6, Il12p40, Nos2 n = 9) or chow (n = 5 except Il1, Tnf, Nos2 n = 4) feeding.
*P < 0.05, **P<0.01, ***P<0.001 (one- or two-tailed Student’s t-test for pairwise comparisons, one-way ANOVA for multiple comparisons involving two independent variables). Data are mean ± s.e.m. See source data for precise p values.

