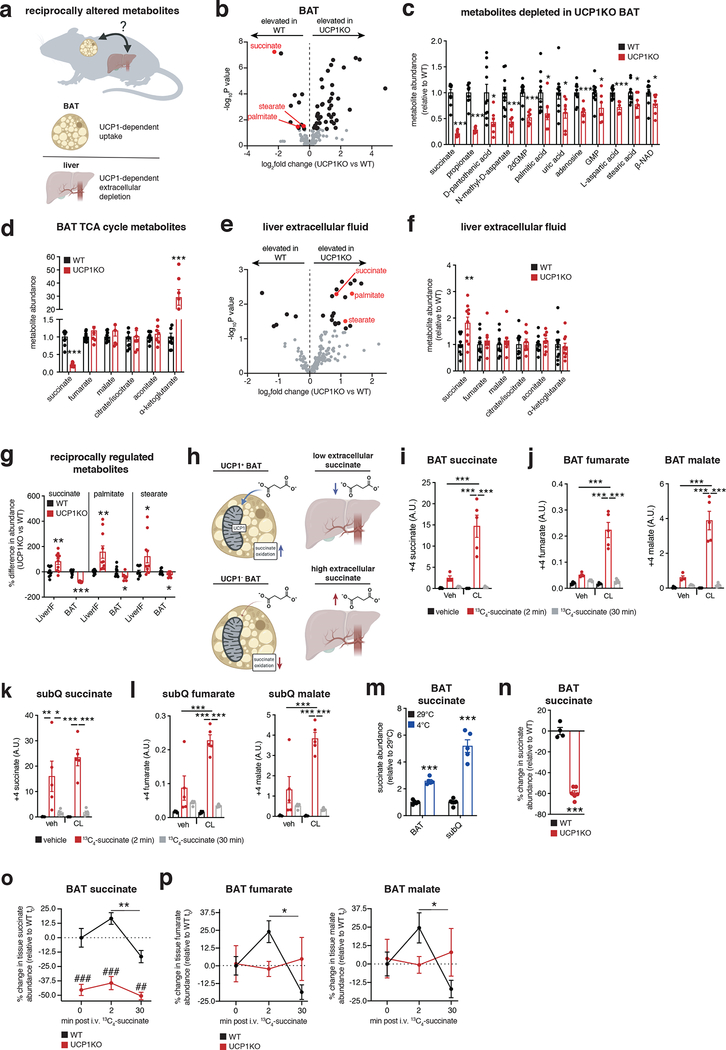
Figure 3: The UCP1 catabolic circuit controls liver extracellular succinate levels.
a, Metabolomics strategy to identify liver extracellular fluid (EF) metabolites regulated by BAT.
b, e, BAT (b) and liver EF (e) metabolomics: annotated metabolites (grey), metabolites significantly changed (black), metabolites downregulated in BAT and upregulated in liver EF (red) following 14 weeks on WD; WT (n = 10) and UCP1KO (n = 7 for BAT; n = 10 for liver EF).
c, d, f, Significantly downregulated metabolites in UCP1KO BAT (c) or abundance of TCA metabolites in BAT (d) or liver EF (f) following 14 weeks on WD; WT (n = 10) and UCP1KO (n = 7 for BAT; n = 10 for liver EF).
g, Metabolites downregulated in BAT and upregulated in liver EF following 14 weeks on WD (n = 10, except BAT UCP1KO n = 7).
h, Model for BAT control over succinate levels.
i-l, Abundance of (m + 4) 13C-succinate (i, k) and (m + 4) TCA cycle metabolites (j, l) in BAT (i, j) and subQ (k, l) from chow fed mice following 10 days daily injection with vehicle or CL-316,243 (1 mg/kg) and subsequent bolus i.v. 13C-succinate (100 mg/kg) for the indicated times (n = 5, except CL (veh) n = 4 and veh (2 min) n = 4 in j).
m, Abundance of succinate in BAT and SubQ adipose tissue from chow fed mice comparing 29°C to 2 weeks 4°C exposure (n = 5).
n, Abundance of succinate in BAT of chow fed WT (n = 4) and UCP1KO (n = 6) mice.
o, p % change in abundance of total BAT succinate (o) and downstream TCA cycle metabolites (p) in BAT of WT and UCP1KO chow fed mice following bolus i.v. 13C-succinate (100 mg/kg) for the indicated times (WT 0, 30 mins and UCP1KO 30 mins n = 5; WT 2 mins and UCP1KO 0, 2 mins n = 6).
*P < 0.05, **P<0.01, ***P<0.001. (two-tailed Student’s t-test for pairwise comparisons, one-way ANOVA for multiple comparisons involving independent variable, two-way ANOVA for multiple comparisons involving two independent variables). Data are mean ± s.e.m. See source data for precise p values.

