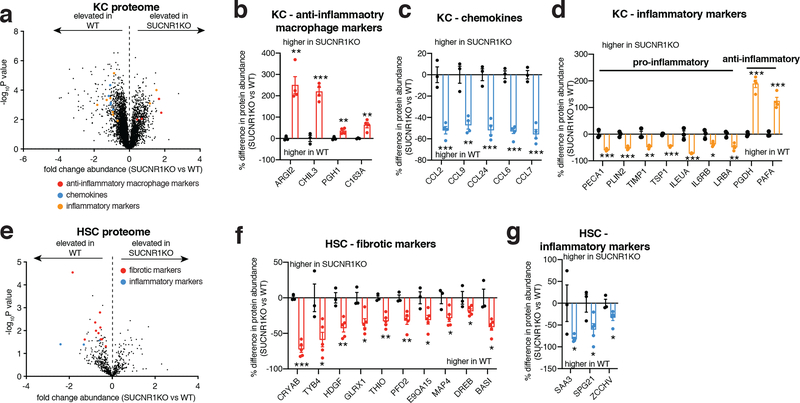
Figure 7: SUCNR1 regulates inflammation and activation in liver resident KC and HSC populations.
a-d, Protein abundance differences of annotated proteins between KCs isolated from WT and SUCNR1KO mice. (WT n = 3, SUCNR1KO n = 4). Data represent fold over WT.
e-g, Protein abundance differences of annotated proteins between HSCs isolated from WT and SUCNR1KO mice. (WT n = 3, SUCNR1KO n = 5). Data represent fold over WT.
*P < 0.05, **P<0.01, ***P<0.001, (two-tailed Student’s t-test for pairwise comparisons). Data are mean ± s.e.m. See source data for precise p values.

