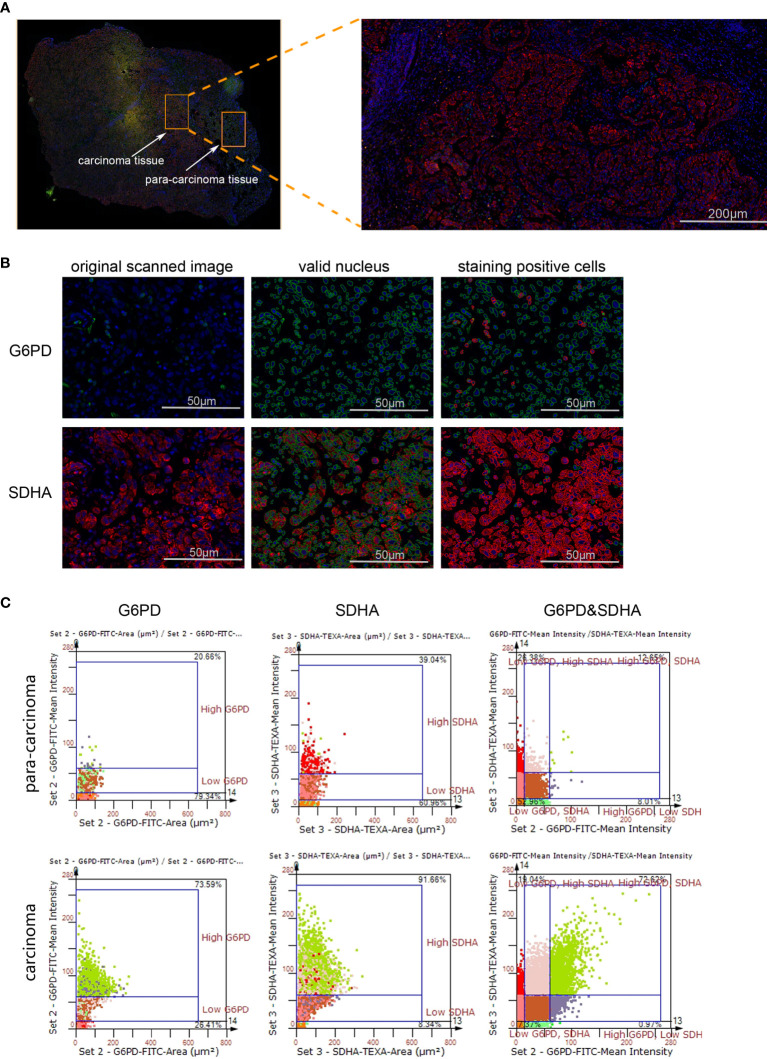
Figure 1.
The expression levels of G6PD and SDHA are up-regulated in NSCLC. (A) Scanned panorama of human NSCLC tissue stained for G6PD (FITC), SDHA (TEXAS RED) and nuclear DAPI, with the representative carcinoma region amplified. (B) Analysis procedure for expression level of target proteins: Valid nuclei, indicated as green circles, were recognized based on size and DAPI intensity; then staining positive cells were identified as indicated by red circles. (C) Presentation of G6PD and SDHA expression levels based on staining area and intensity in carcinoma versus para-carcinoma regions. The upper number and lower number in each chart respectively denoted staining positive cells and staining negative ones.

