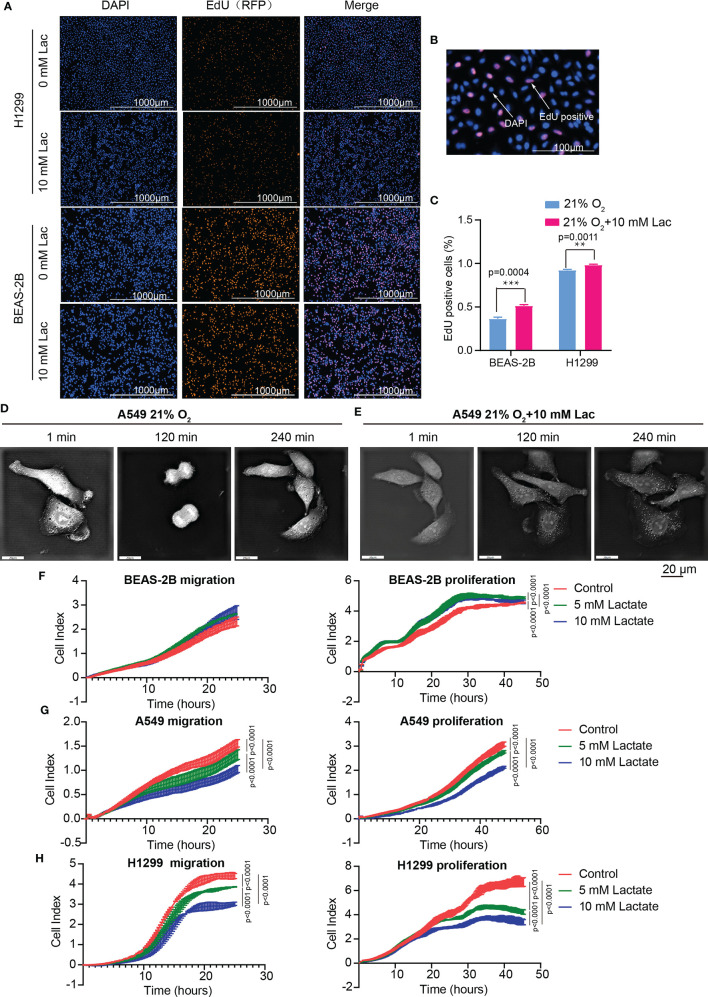
Figure 5.
Lactate modulated cell proliferation. (A) Representative cell images stained with nuclear DAPI and EdU (RFP) in EdU-incorporating assay. (B) Locally amplified image to clearly show EdU-positive cells, which were going through S phase of cell cycle. (C) The percentage of EdU-positive cells in the indicated groups. (D, E) Cell division progression of A549 cells observed via holographic tomographic microscopy 3D cell explorer for 6 hours, when the cells treated without (D) or with (E) lactate. (F–H) RTCA assays of cell migration and proliferation. Migration and proliferation of BEAS-2B (F), A549 (G) and H1299 (H) when the cells were treated with the indicate concentrations of lactate. (**p<0.01, ***p<0.001, ****p<0.0001).

