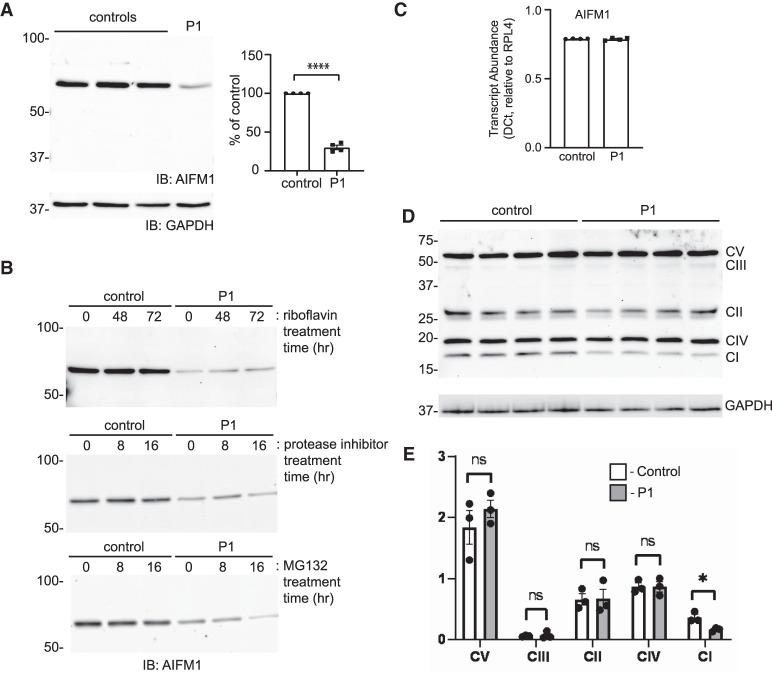
Figure 2.
Reduced AIFM1 levels and variable decreases in respiratory chain complexes in patient fibroblasts. (A) Representative western blot of control and P1 fibroblasts and quantification of relative abundance by densitometry (n = 4). Error bar represents standard error of the mean. (B) Western blot for AIFM1 protein in control and patient cells treated with either 50 µM riboflavin for 48 and 72 h, 10 mM protease inhibitor cocktail for 8 and 16 h, or 10 mM MG132 for 8 and 16 h. (C) Quantitative polymerase chain reaction (PCR) analysis of AIFM1 transcripts in wild-type (WT) and patient fibroblasts. (D) Western blot of different electron transport chain subunits in four replicates of control and P1 fibroblast lysates. The position of each Complex subunit is marked. (E) Quantification by densitometry of the relative abundance of each subunit (n = 3). Error bars represent standard error of the mean.

