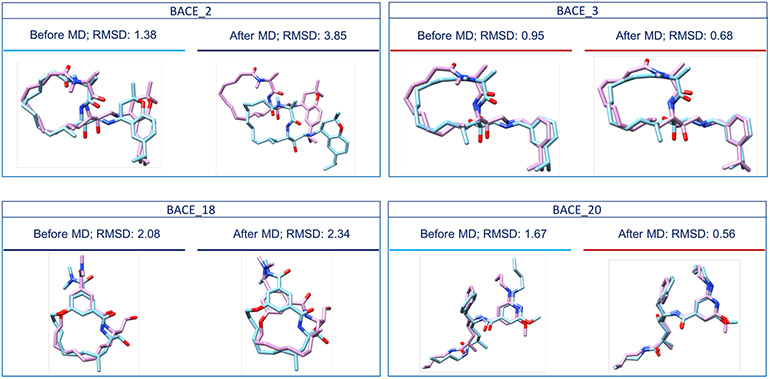
Fig. 6.
Comparison of the crystal structures of BACE_2, BACE_3, BACE_18 and BACE_20 (in pink) with our Stage 1b ‘best’ ranking poses before MD simulations (in blue) and our Stage 1b ‘best’ ranking poses after MD simulations (in blue), respectively. MD affected our performance in different ways for different ligands. For example, the worst RMSD value was reported for the BACE_2 ligand, the RMSD value corresponding to the BACE_18 ligand increased after MD, and the RMSD values corresponding to the BACE_3 and the BACE_20 ligands decreased after MD. Compounds underscored by a red line have RMSD values less than 1 Å, those underscored by a light blue line have RMSD values less than 2 Å and those underscored by a navy blue line have RMSD values higher than 2 Å.

