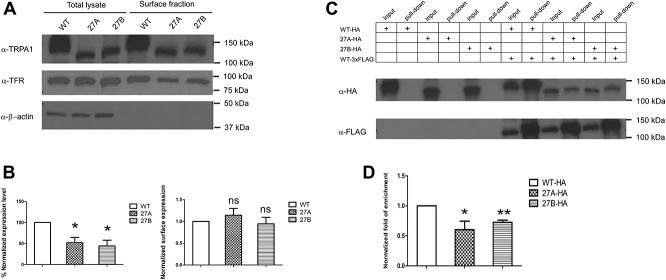
Figure 2.
hTRPA1_27A and 27B splice variants displayed the lower expression level, normal surface localization, and reduced binding affinity to the WT. (A) Surface biotinylation detected localization of WT, 27A, and 27B splice on the plasma membrane. Transferrin receptor (TFR) was used a marker for surface protein. (B) Left, densitometry analysis of the expression level of WT, 27A, and 27B in HEK293FT cells. The intensity of the WT, 27A, and 27B in total lysate fraction were first normalized against β-actin, respectively. The normalized intensity of 27A and 27B was then compared against that of the WT. * P < 0.05 (Student unpaired t test). Values shown are mean ± SEM (n = 3). Right, densitometry analysis of surface localization of WT, 27A, and 27B protein in HEK293FT cells. The ratio of surface fraction were first normalized against the input for each of the WT, 27A ,and 27B before normalization against surface over total ratio of TFR of the respective sample. The normalized intensity of 27A and 27B was then compared against the WT. ns, nonsignificant (Student unpaired t test). Values shown are mean ± SEM (n = 3). (C) Top, HEK293FT cells were transfected with HA-tagged WT, 27A or 27B variant alone or cotransfected with 3xFLAG-tagged WT. Bottom, experiment was performed by pulling down 3xFLAG-tagged WT with mouse (ms) anti-FLAG antibody, and subsequently, the HA-tagged protein subunit were detected with rabbit (rb) anti-HA antibody. The input and pull-down fractions were detected for each condition. The result is representative of 5 independent experiments. (D) Bar chart reporting the densitometry quantification of the pull-down efficiency. The band intensity of the pull-down fraction was first normalized against the input fraction for each of the HA-tagged WT, 27A, and 27B. The ratio was then normalized against the pull-down over input ratio of the 3xFLAG-tagged WT of each sample. The normalized ratio obtained for 27A and 27B variants were then compared against that of the WT * P < 0.05, ** P < 0.01 (Student unpaired t test). Values shown are mean ± SEM (n = 5). TRPA1, transient receptor potential ankyrin 1.

