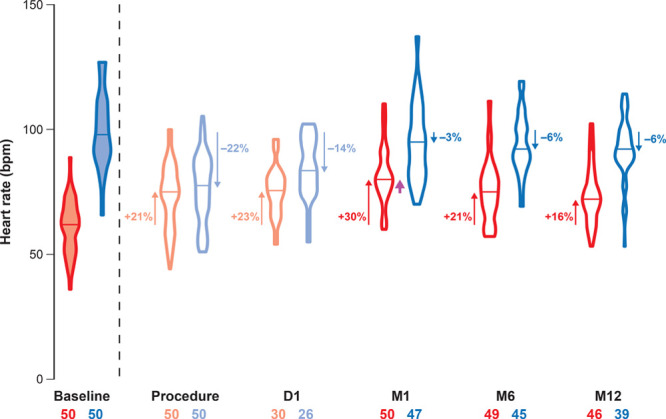
Figure 4.

Basal heart rate (HR) and HR after atropine injection. Basal HRs are represented by red violin plots. Reset basal HRs after ablation and 1 d later are represented by pale-red violin plots. Corresponding HRs after atropine are shown by the blue and pale-blue violin plots. The median value is mentioned for each violon plot by a horizontal line. The number of patients involved (X–X) and level of the median HR modification compared with baseline (%) are shown. HR acceleration (upward arrows) or deceleration (downward arrows) were all significant compared with baseline (P<0.001). The median basal HR at M6 and M12 was comparable with the postprocedural basal HR while the median basal HR at M1 was significantly higher (purple arrow; P<0.001). D indicates day; and M, month.
