Figure 3.
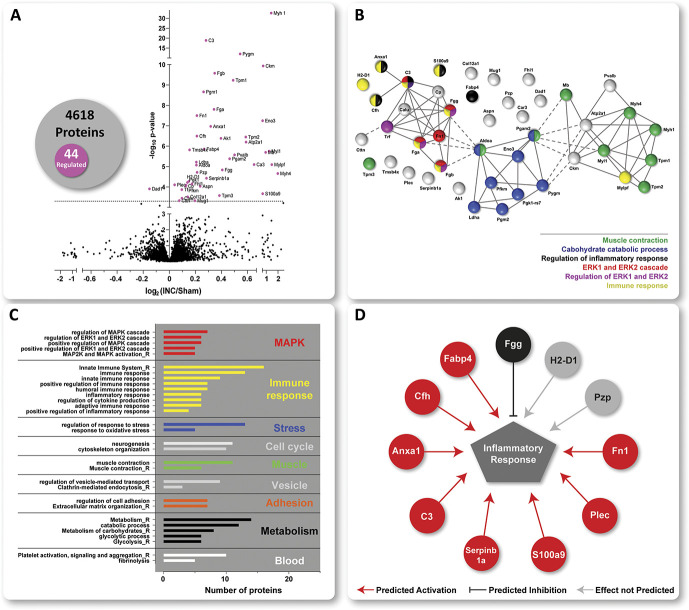
Protein signature of incisional pain in iDRG. (A) The Volcano plot displays the mean log2 fold change (log2 INC/Sham) of detected proteins and corresponding -log10 of Q values on comparing protein intensities between INC and Sham. 44 of a total of 4618 quantified proteins were significantly regulated (magenta-colored circles above the dotted horizontal line, which represents Q < 0.05, ie, BH-adjusted P-value) on INC compared with Sham. The numbers are summarized in the Venn diagram. STRING-based predicted, relationship across the 44 regulated proteins (B). Three major clusters were identified with functionally distinct gene ontology (GO) annotations (see grey inlay) such as muscle contraction, carbohydrate catabolic process, immune and inflammatory responses, including regulation of ERK1/2. Settings for network visualization with STRING were as follows: confidence view, confidence level 0.7, and clustering algorithm MCL set to 3. GO-analysis for biological process (BP) and REACTOME (R) pathways (C). Regulated proteins are associated with major cellular pathways of which selected ones are shown, for example, stress response, cell cycle, vesicle-mediated transport, adhesion, and blood platelets). For full data sets, please see Table, Supplemental Digital Content 7, available at http://links.lww.com/PAIN/B275. Only annotated pathways, which exhibit significant enrichment ( false discovery rate < 0.05; assessed via the web-based interface STRING) are reported. Several regulated candidates are implicated in inflammatory responses (D) as assessed by Ingenuity Pathway Analysis (IPA)-based activity prediction analysis (IPA, Qiagen, 2000-2017). Red lines predicted activation; black lines represent predicted inhibition; grey lines show predictions, which are not defined. DRG, dorsal root ganglia.

