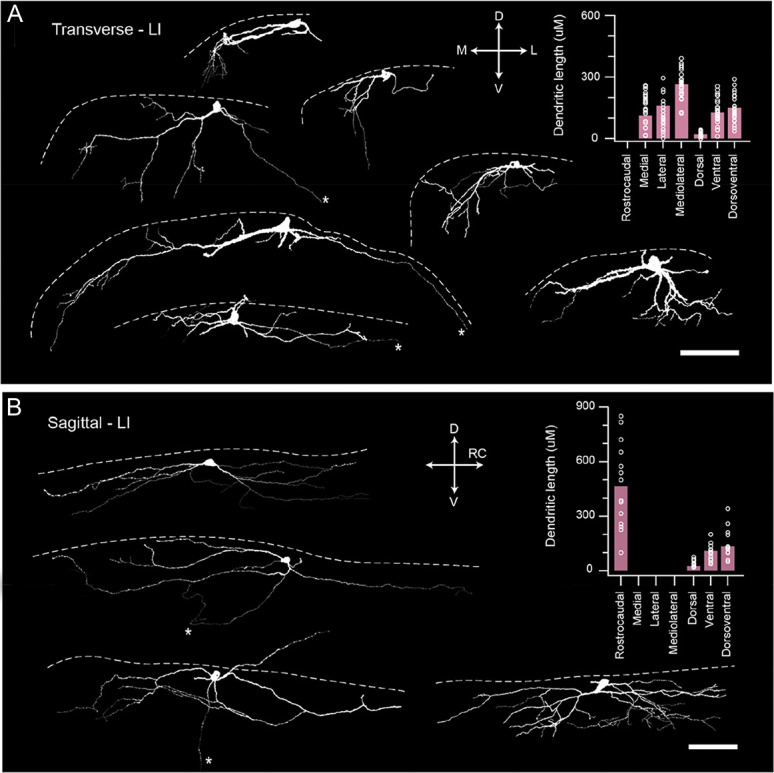
Figure 6.

Morphological properties of SPBNs. (A) Images show examples of LI SPBN morphology recovered from transverse spinal cord slices after patch clamp recordings (dashed white line denotes position of dorsal gray/white matter border). Red image shows a Neurobiotin-recovered LI SPBN, with traced cell below (white). Several traced cells show the diversity of LI SPBN morphologies. Group data plot (right) summarizes LI SPBN dendritic dimensions in the rostrocaudal, mediolateral, and dorsoventral planes. Note: rostrocaudal measurements were not included because of tissue slice orientation. (B) Images show examples of LI SPBN morphology recovered from sagittal spinal cord slices after patch clamp recordings. Red image shows a Neurobiotin-recovered cell (maximum intensity z projection) with traced image below, as in (A). Several traced cells show the range of LI SPBN morphologies. Group data plot (right) summarizes LI SPBN dendritic dimensions as in (A). Note: mediolateral dimensions were excluded because of the orientation of the slice preparation. (scale A and B: 100 μm). SPBNs, spinoparabrachial projection neurons.
