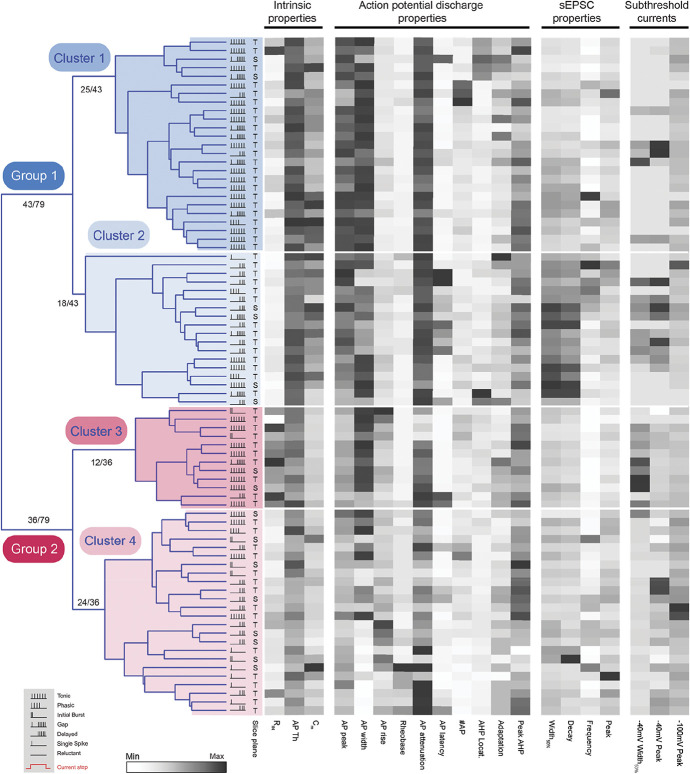
Figure 8.
Hierarchical cluster analysis of LI SPBNs identifies distinct subpopulations. Dendrogram and heatmaps plotting the assignment of LI SPBNs into clusters based on their electrophysiological properties. The AP discharge patterns of each SPBN are annotated using the key in the lower left gray box (inset). Dendrograms show clusters (4 in this analysis) determined using a K-Means silhouette scoring method. Unsupervised clustering of SPBNs differentiated 2 major groups (blue and red) of approximately equal numbers (43 and 36), with each group subsequently further divided into 2 clusters (light and dark shading). Heatmaps present the relationship of 20 electrophysiological characteristics, normalised to maximum (black) and minimum (white) values for each property, aligned to each LI SPBNs cluster assignment. AP, action potential; SPBNs, spinoparabrachial projection neurons.

