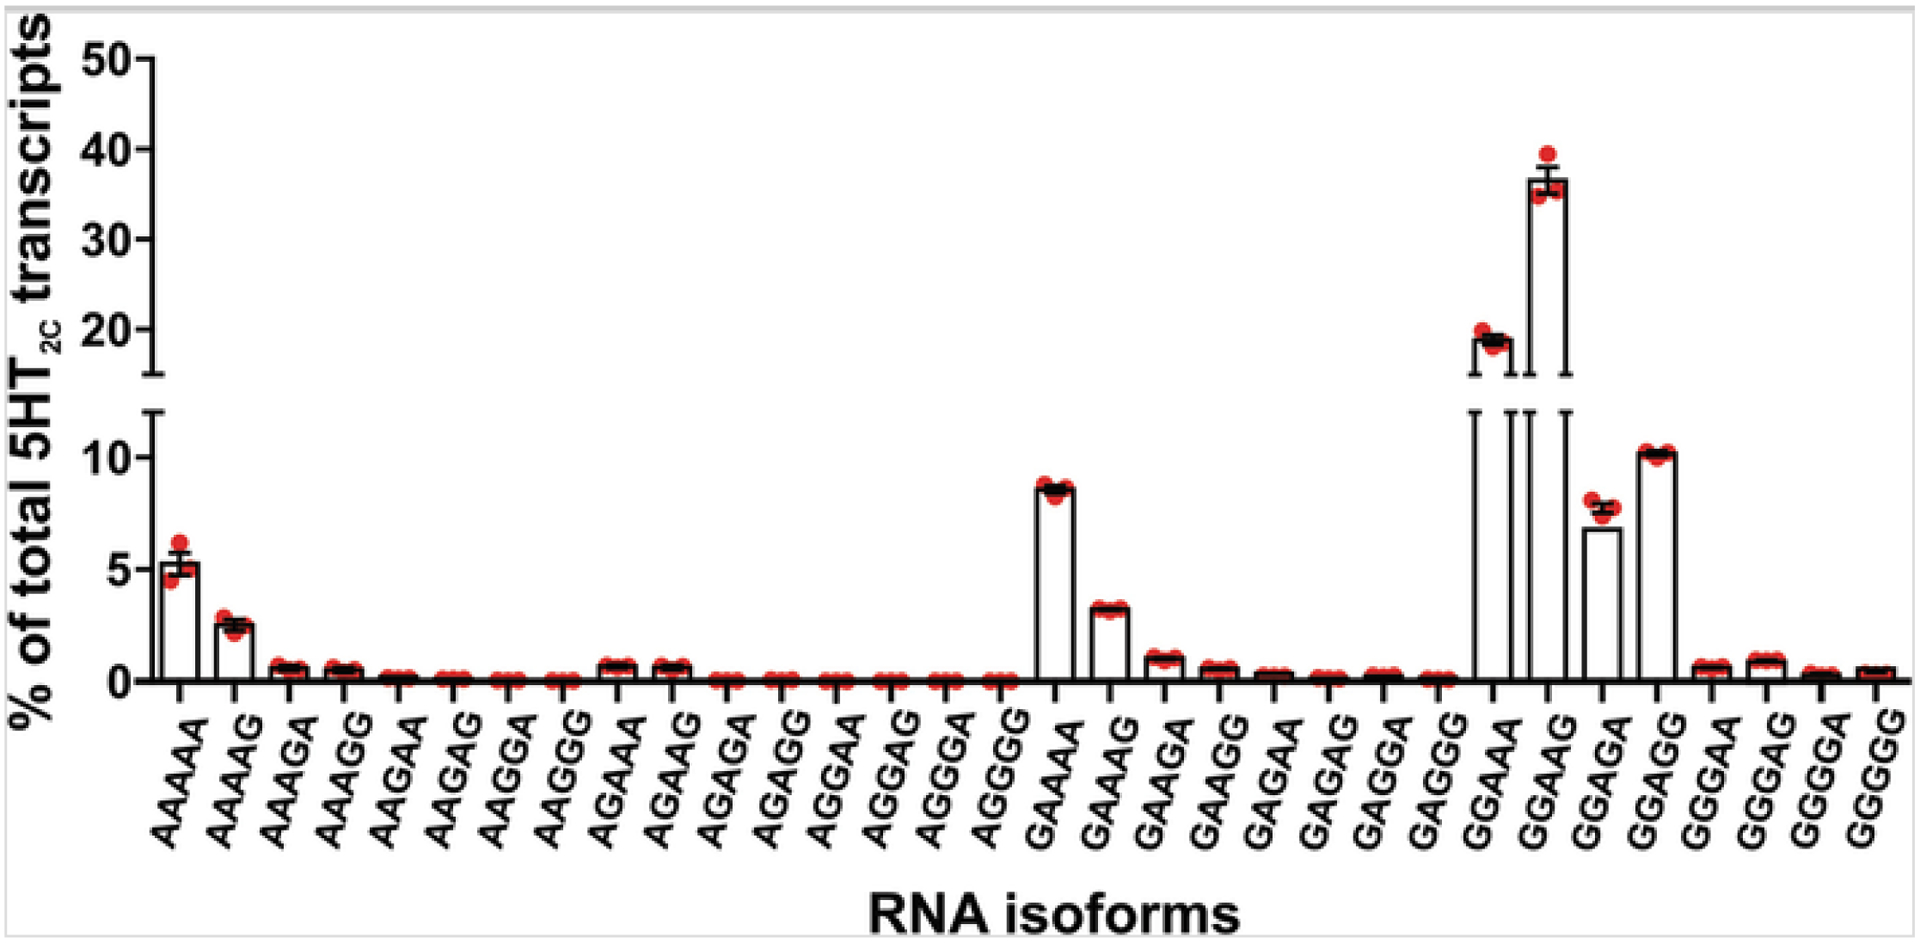
Fig. 3.

Quantification of 5HT2C RNA editing profiles in mouse hypothalamus using high-throughput sequencing. The relative expression for all possible 5HT2C isoforms generated by RNA editing is represented as the percentage of total 5HT2C sequence reads; mean ± SEM, n = 3. The 32 possible permutations of A-to-I editing are designated according to the presence of either an adenosine (A) or a guanosine (G) at each of the five distinct editing sites within the analyzed cDNA library (e.g., AAAAA = non-edited, GGGGG = fully edited)
