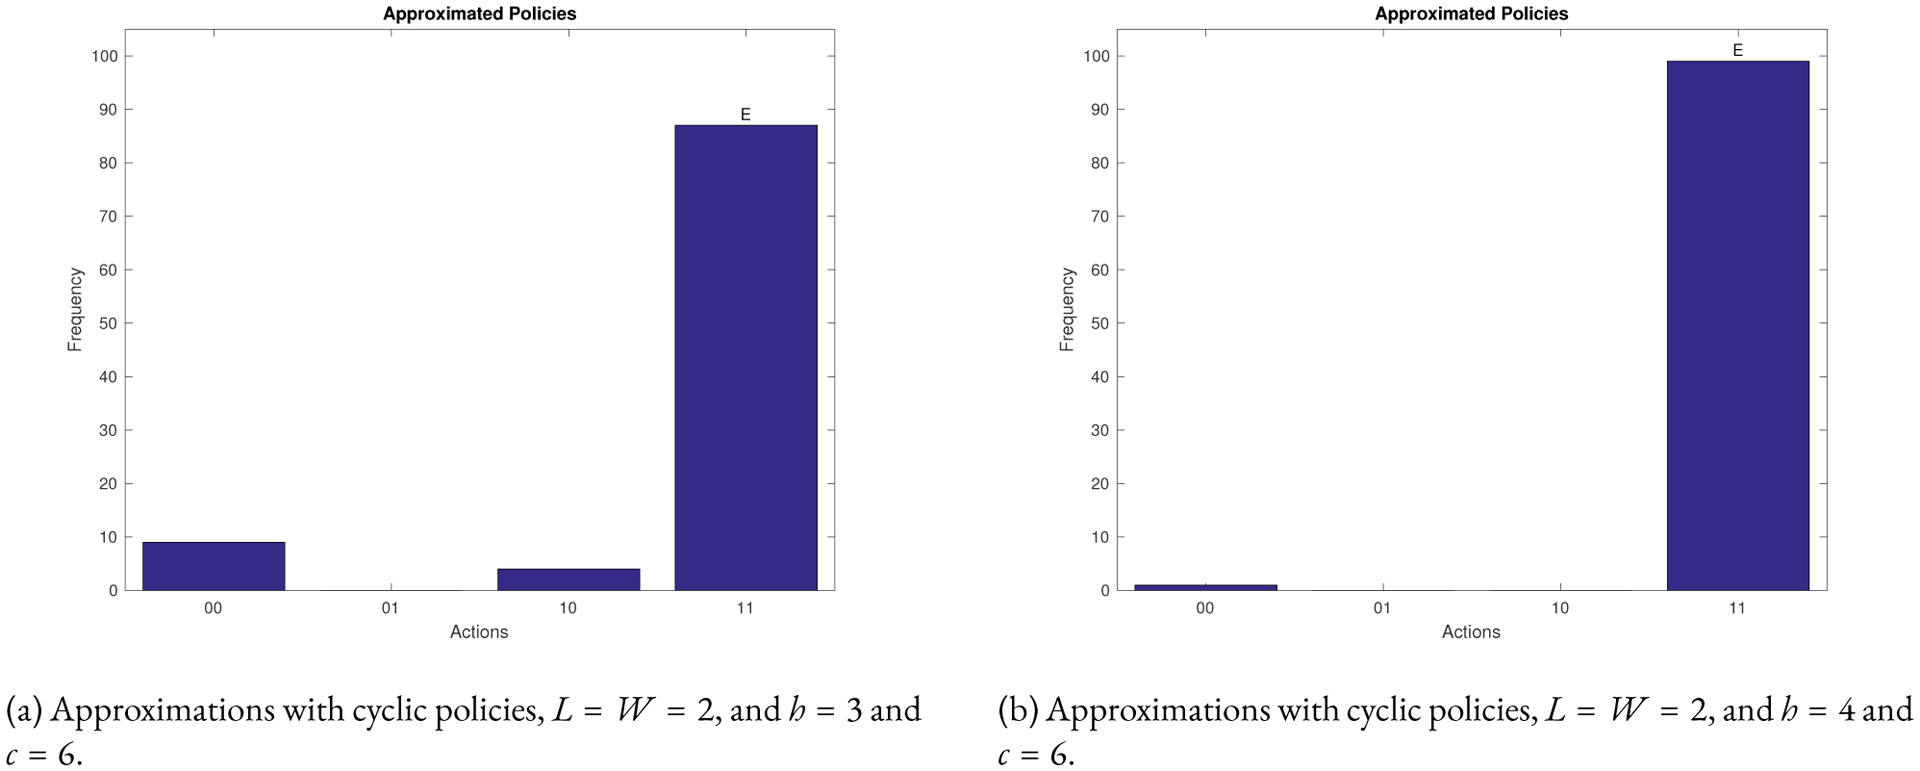
Figure 4:

Statistics from using the approximation algorithm for the 60 nodes T-LGL network for the state in Equation 3. Algorithm 3 was used 100 times. The vertical axis shows the frequency of control actions predicted by the approximation algorithm. The horizontal axis show all possible control actions. The simulations contain noise of p=0.05.
