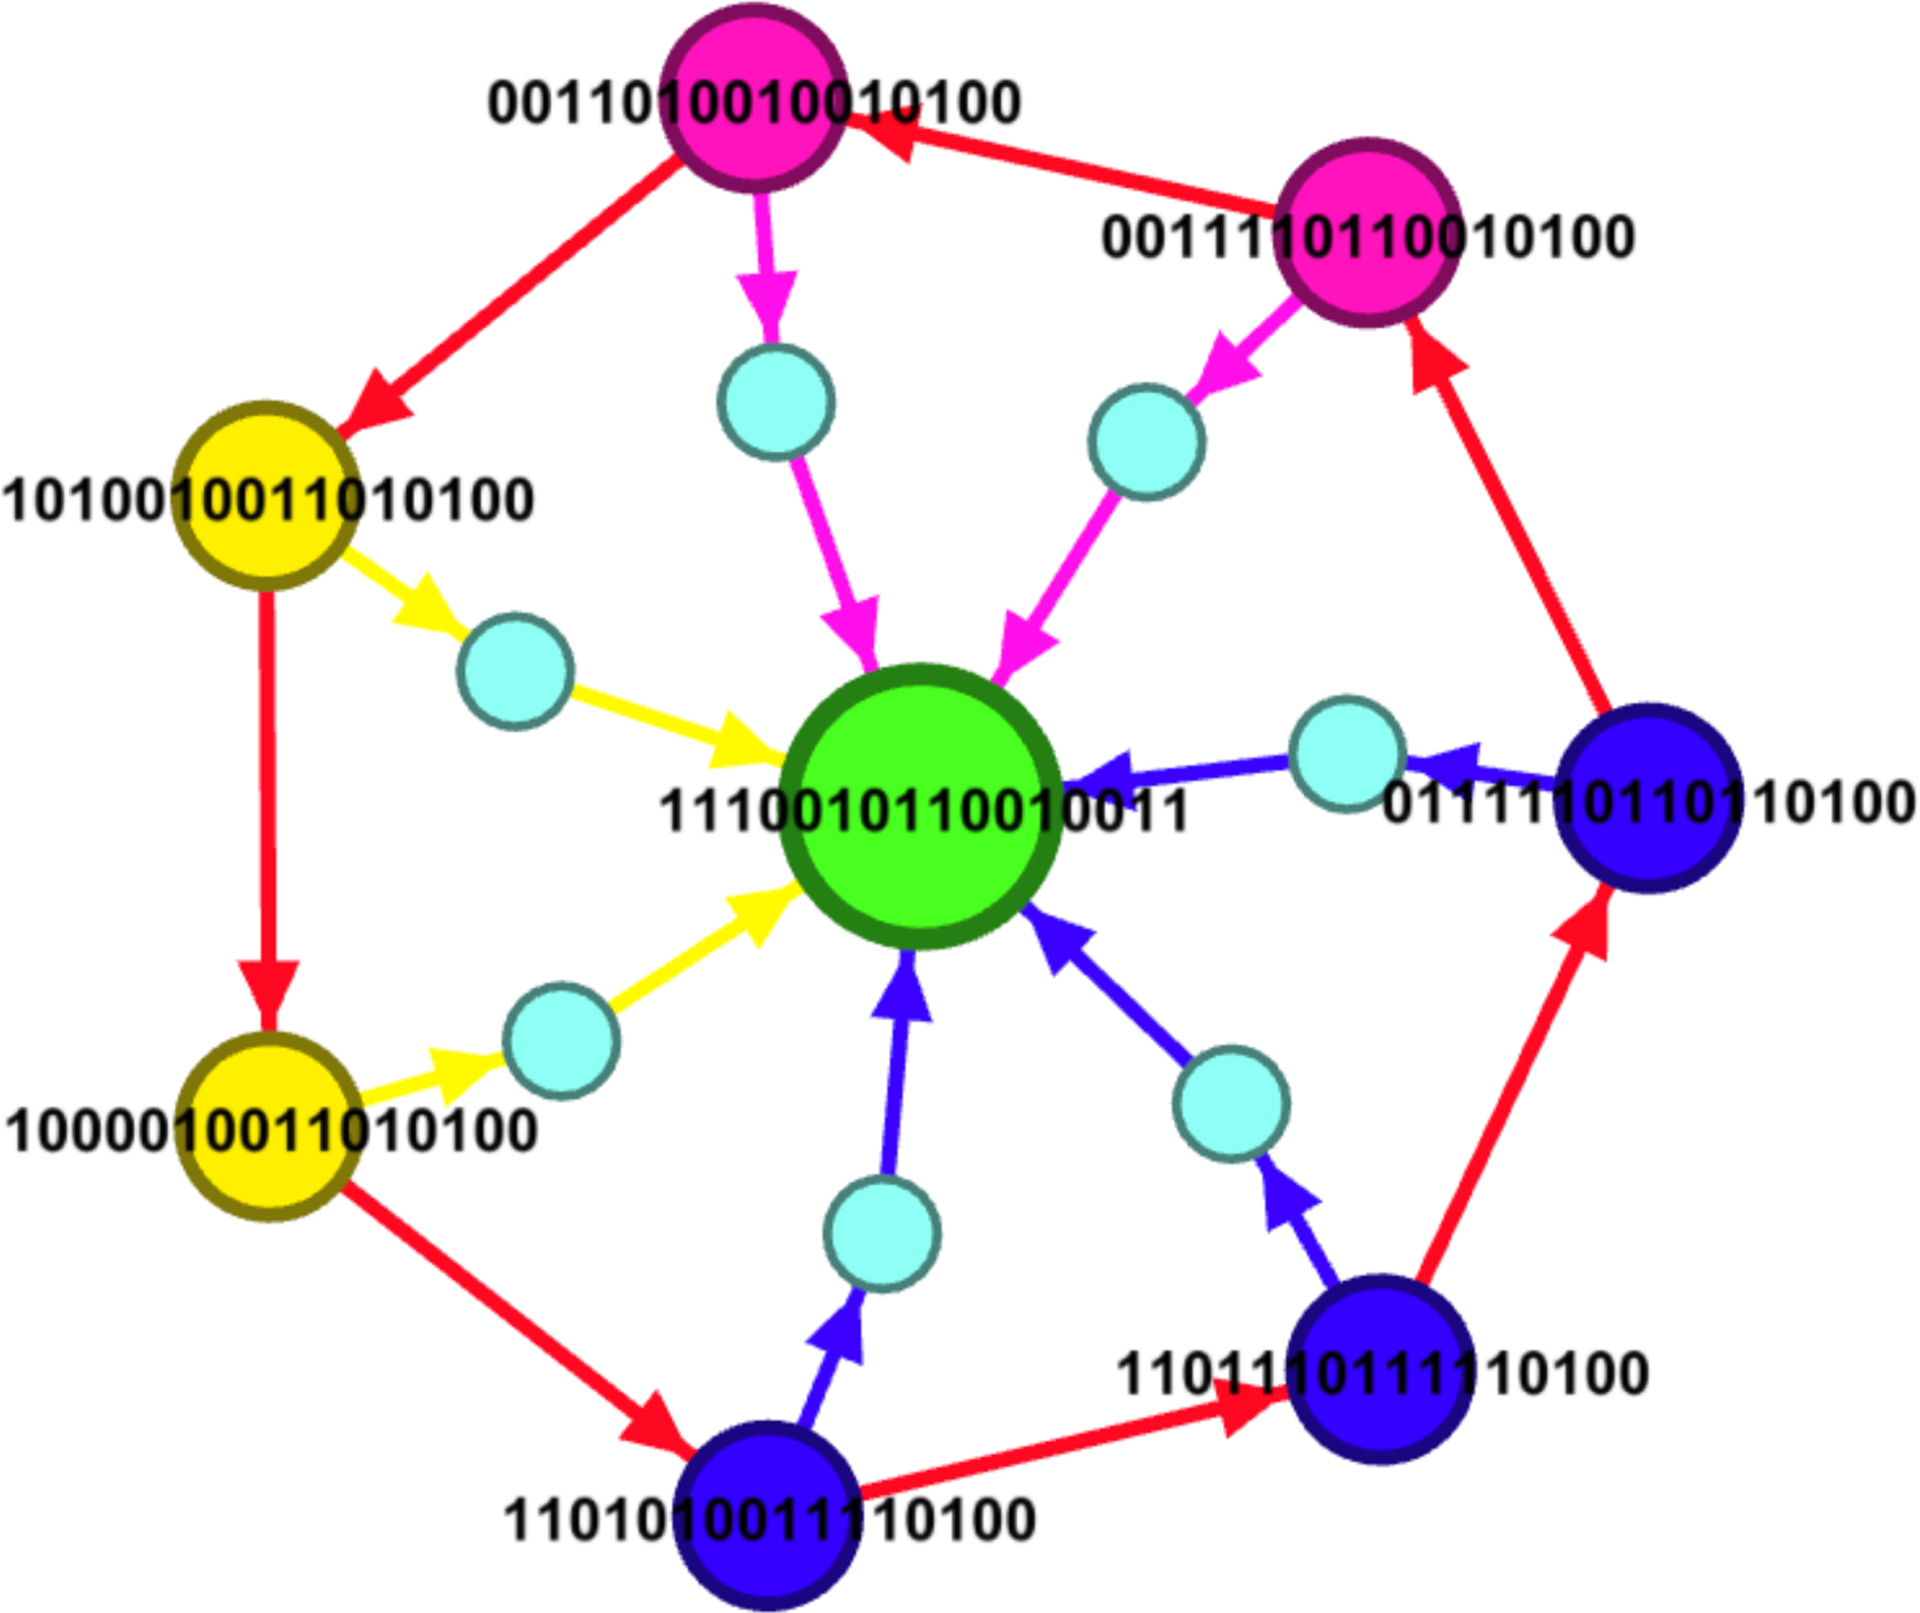
Figure 5:

Simulations using the control policies given in Table 3 for the states of the limit cycle of the p53-mdm2 network. For each cycle state, we applied the control edges given in columns 2–4 of Table 3. The smaller intermediate nodes indicate that the controls have been applied twice, for 5 steps each time. The colors indicate the different policies indicated in Table 3. Nodes with the same color have the same control policy as specified in Table 3.
