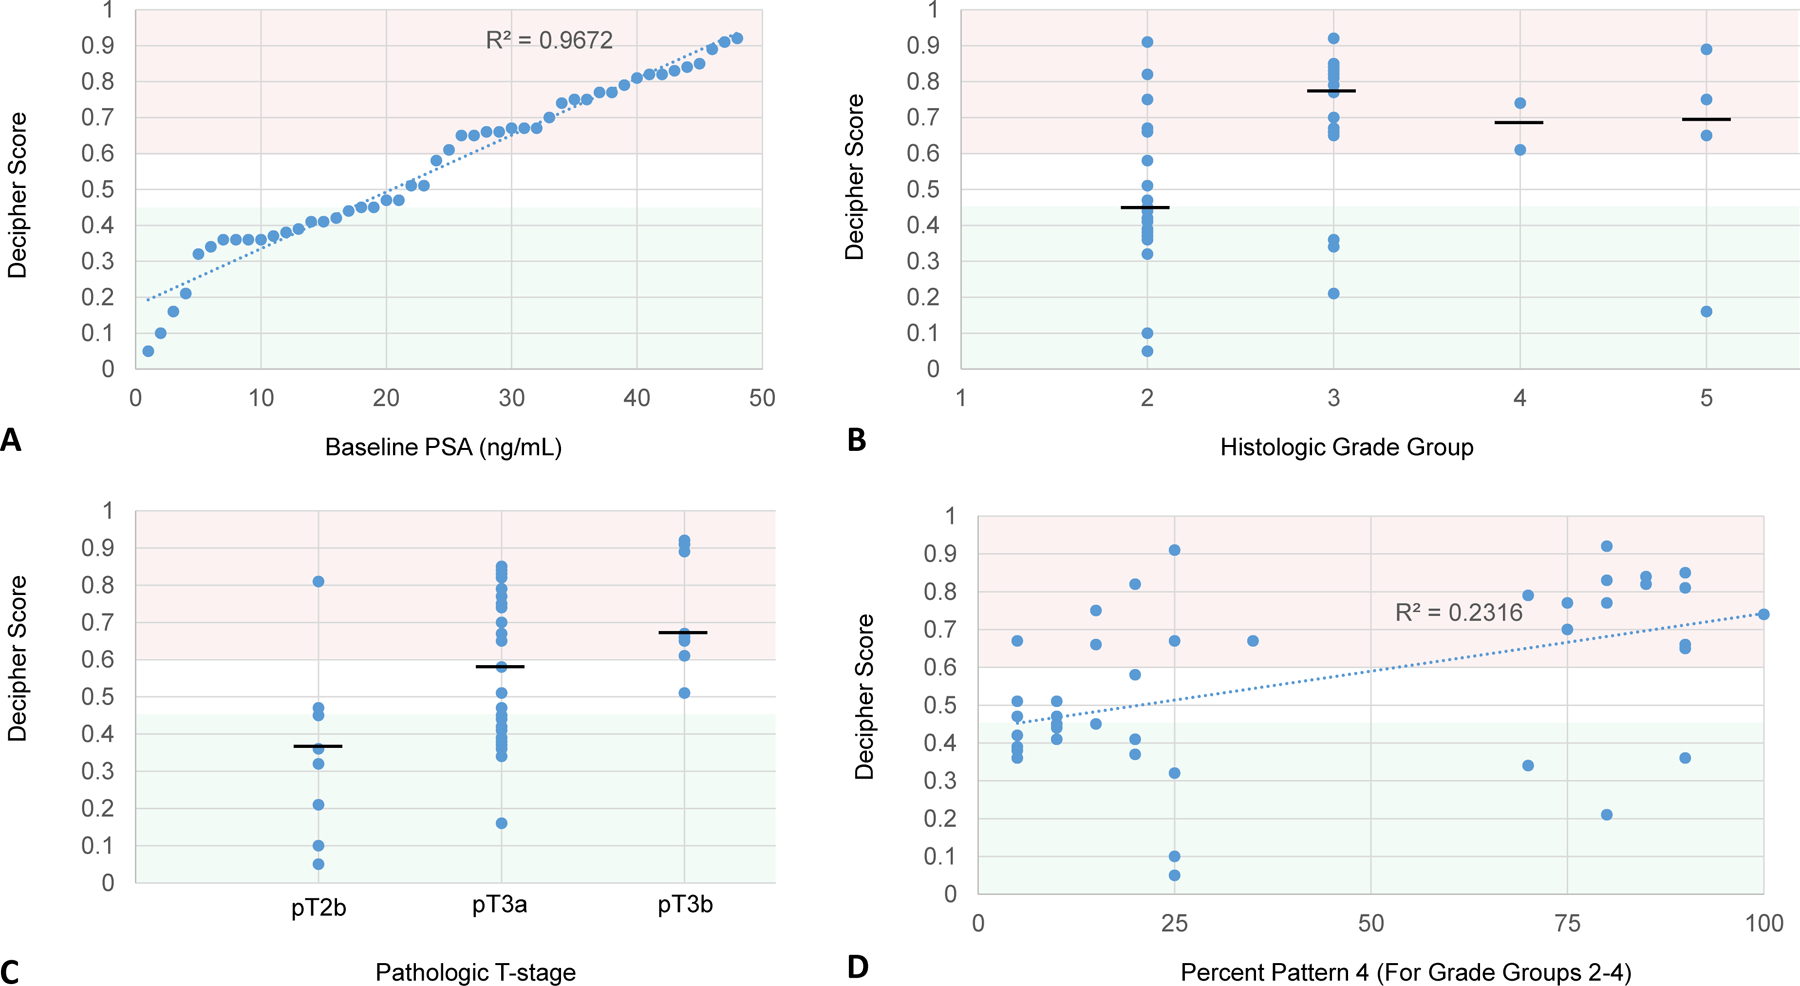
Figure 1:

Decipher scores plotted against baseline PSA (A), histologic grade group (B), pathologic T-stage (C), and percent Gleason pattern 4 (D). Decipher scores from 0 to 0.45 (shaded green), 0.45 to 0.6 (shaded white), and 0.6 to 1.0 (shaded red), are respectively considered low, intermediate, and high risk. Black horizontal bar represents the median value.
