. 2021 May 6;12(23):8218–8223. doi: 10.1039/d1sc01269j

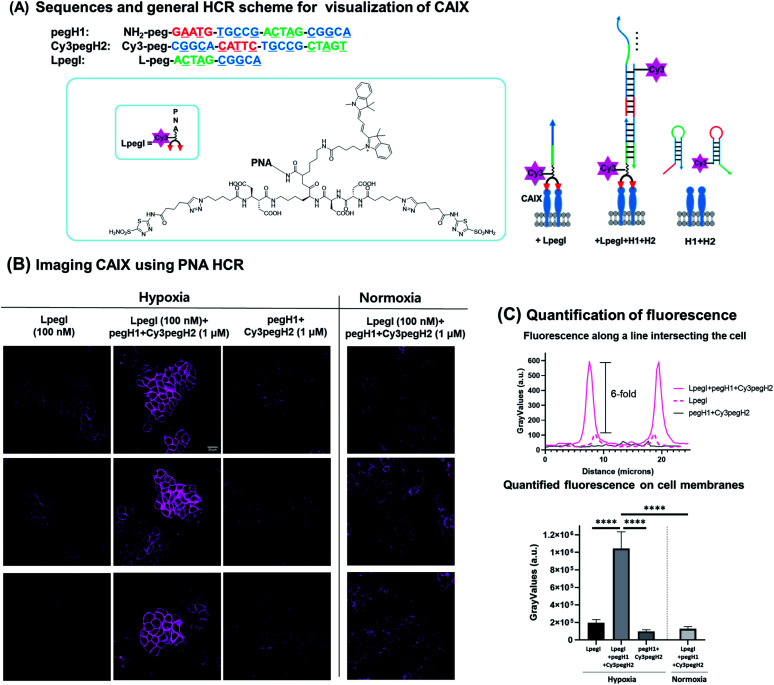
Fig. 6. PNA HCR on CA IX expressing cells. (A) Sequence information and general scheme of the PNA-HCR system for the visualization of CA IX. CA IX was visualized by 1 : 1 ratio imaging with LpegI, PNA HCR (LpegI + pegH1 + Cy3pegH2), or only hairpins (pegH1 + Cy3pegH2). (B) Fluorescence pictures of HT-29 cells treated with LpegI; LpegI + pegH1 + Cy3pegH2; pegH1 + Cy3pegH2 under hypoxic conditions or treated with LpegI + pegH1 + Cy3pegH2 under normoxic conditions. Scale bar: 20 μM. (C) Fluorescence intensity profiles recorded along a line intersecting the cell and quantification of fluorescence on cell membranes. Error bars represent standard deviation. Statistics were calculated using an unpaired t-test. ****p < 0.0001.

Fig. 6