. 2021 May 4;12(23):8178–8189. doi: 10.1039/d1sc00957e

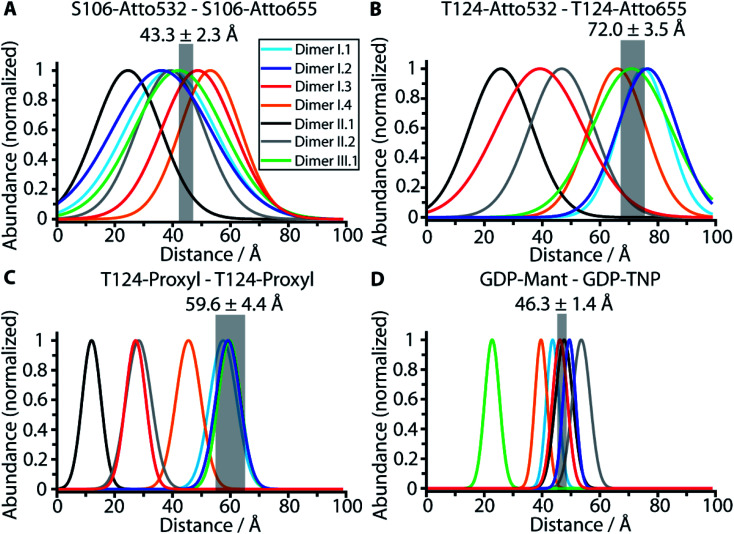
Fig. 3. Comparison of the experimental distances with the calculated distances for predicted dimer structural models. The experimental values obtained by FRET and EPR measurements (Fig. S4) are shown as transparent grey bars. Only dimer structural models I.1 and I.2 are in line with all four measured distances as revealed by the comparison of the measured distances S106–S106 (A), T124–T124 (B), T124–T124 (EPR) (C) and nucleotide–nucleotide (D) (grey bars) with the calculated distance distributions based on the dimer structural models I.1 (light blue), I.2 (dark blue), I.3 (cyan), II.1 (black), II.2 (grey) and III.1 (green) as detailed in ESI Note 5. The width of the calculated distribution reflects the steric maximal possible conformational space of the labels that provide the outer limit. If the experimental value is not within the calculated distribution in one of the four plots the structure is ruled out.

Fig. 3