. 2021 May 12;12(23):8260–8267. doi: 10.1039/d1sc01201k

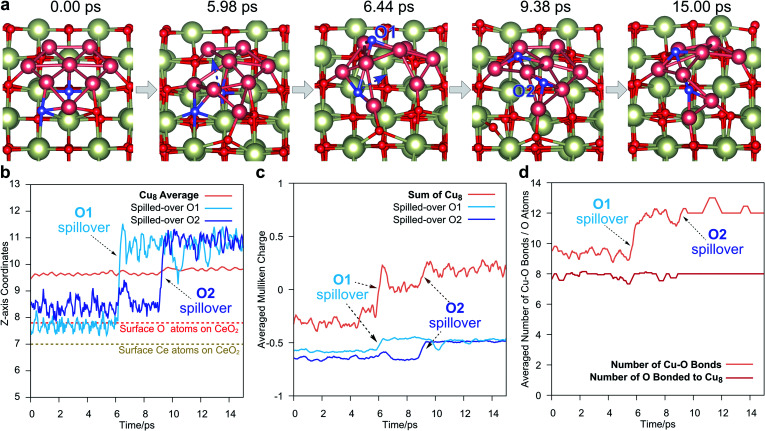
Fig. 3. Spillover takes place in the AIMD with the monolayer Cu8 cluster configuration on the CeO2(111) surface. (a) Typical configurations in AIMD of 15 ps. During the simulation, two O spillovers take place. The colors are the same as those in Fig. 1, and the spilled-over O is colored in blue. (b) The Z-axis coordinates of Cu8 and the two spilled-over O in AIMD. The label of the spilled-over O is shown in (a). (c) Mulliken charges of Cu8 and the two spilled-over O in AIMD. For smoothing the curve, the charges are averaged by the data of the following 0.5 ps. (d) The number of Cu–O bonds (brown line) and the total O atoms bonded to Cu8 (red line). The Cu–O bond is expected to be formed within 2.43 Å, which is determined by the radial distribution function (RDF) of O atoms around Cu, as shown in Fig. S6. The numbers on both curves are also averaged by the data of the following 0.5 ps.

Fig. 3