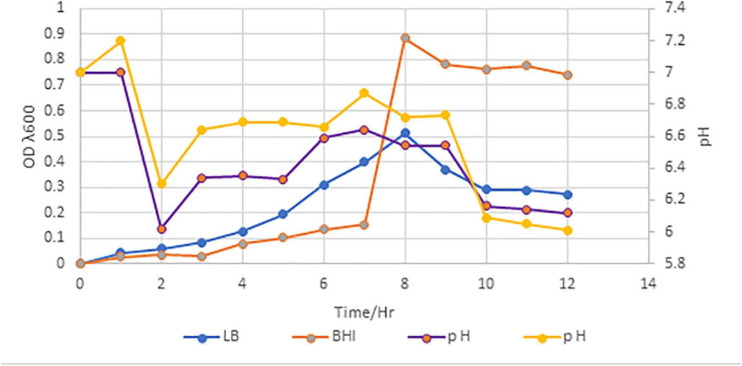
FIGURE 1.
Growth curve of P. peoriae IBSD35 in BHI and LB broth media, and their OD and pH after 12 h incubation. A customize graph with three axes; a bottom X axis, one left Y axis and right Y axis. The X axis represents the time, and the left Y axis represents the OD. The right Y axis represents the pH (LB, Luria Bertani; BHI, brain heart infusion; OD, optical density).

