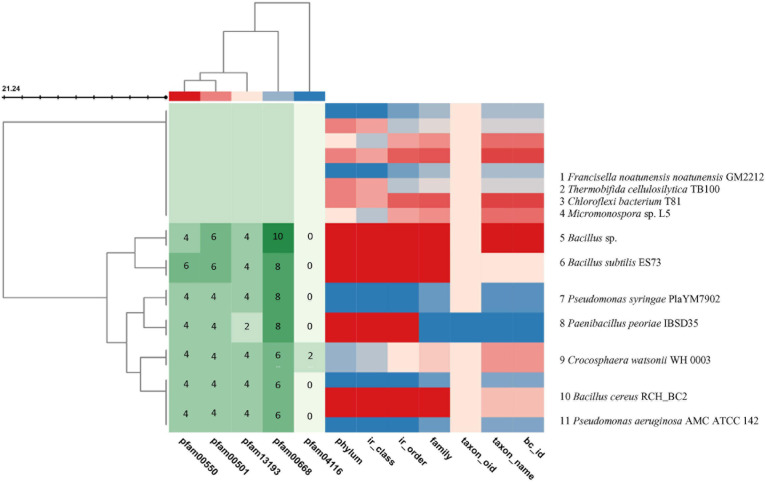
FIGURE 5.
Visualization of the BGCs plotted in color code from the selected 11 genomes using the JGI/ABC database. The color code is represented in numbers to indicate the number of pfam counts using MS Word. The X axis indicates the pfam and the genome taxonomy. The genomes are indicated at the right Y axis. The left branching indicates the phylogeny relation of the BGCs. The BC similarity search was based on pre-calculated pairwise similarity scores using the Jaccard Indexstatistic for comparing two sets. The core genes are pfam00501: AMP-binding enzyme, pfam00550: phosphopantetheine attachment site, pfam00668: condensation domain, pfam04116: fatty acid hydroxylase superfamily. The list of genomes from the JGI/ABC database include: 1, Francisella noatunensis noatunensis GM2212; 2, Thermobifida cellulosilytica TB100; 3, Chloroflexi bacterium T81; 4, Micromonospora sp. L5; 5, Bacillus sp.; 6, Bacillus subtilis ES73; 7, Pseudomonas syringae PlaYM7902; 8, Paenibacillus peoriae IBSD35; 9, Crocosphaera watsonii WH 0003; 10, Bacillus cereus RCH_BC2; and 11, Pseudomonasaeruginosa AMC ATCC 142. (Two scores are calculated: Jaccard Score: fraction of distinct pfams shared between two BCs (intersection) over the total number of distinct pfams in both sets (union). Adjusted Jaccard Score: a modified version of the Jaccard Score that considers the similarity between the number of occurrences of each pfam in each BC).

