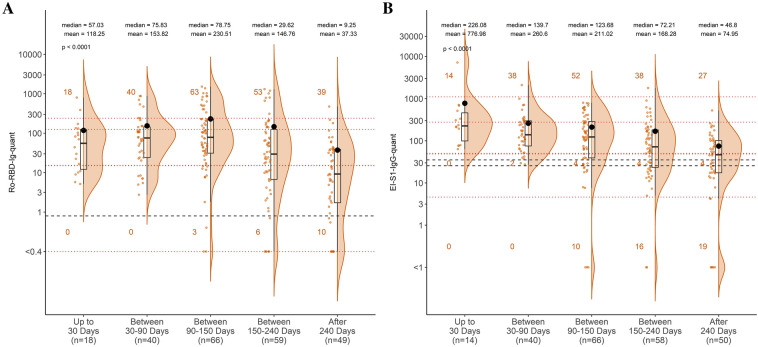
Fig. 2.
Time-dependent values of positive samples in primary tests Ro-RBD-Ig-quant (a) and EI-S1-IgG-quant (b). Black dashed lines represent manufacturers’ cutoff values and red dotted lines represent the WHO standards (from the bottom to the top: 20/142, 20/144, and 20/140 for a (20/140 and 20/144 for b) with almost identical values, 20/148, 20/150). Assay results were categorized according to the time after the positive RT-PCR test (< 30 days, 30–90 days, 90–150 days, 150–240 days, and > 240 days). Plots show the individual read-out (orange dots), a density estimate (orange area), the 25th, 50th, and 75th percentiles (black box), and the mean (black dot); mean and median numbers are included for each group

