FIGURE 3.
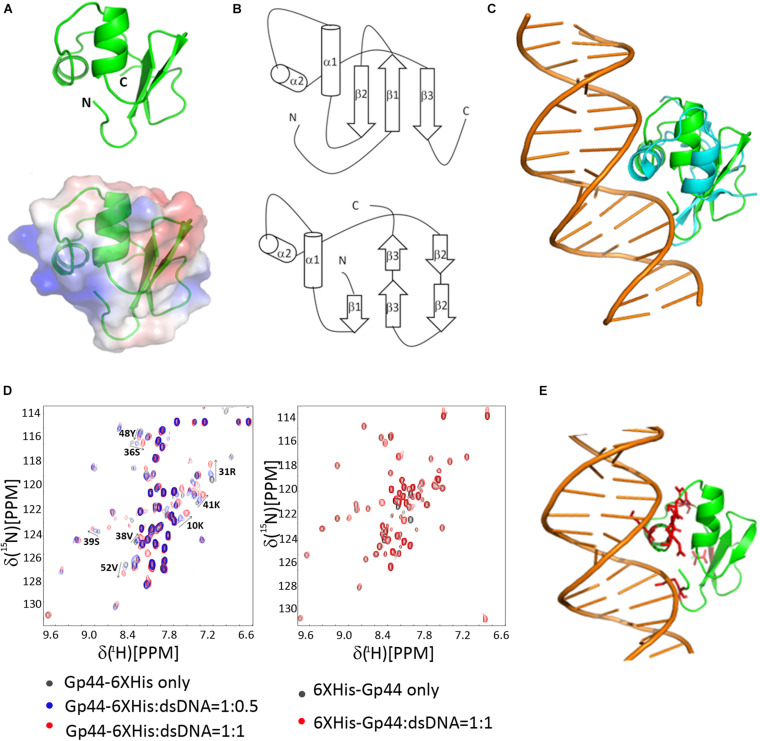
NMR-derived three-dimensional structure of Gp44NT and DNA interaction (A) A cartoon representation of Gp44NT structure (top), and basic electrostatic surface distribution (bottom), calculated using the vacuum electrostatics program in Pymol, version 0.99rc6. Red represents residues with negatively charged sidechain and blue indicate positively charged amino acids. (B) Topologies of Gp44NT (top) and Xis (bottom). (C) Superimposed Gp44_NT (green) and Xis/DNA complex (cyan, PDB ID: 2OG0, DNA major and minor grooves included). (D) Left: Overlay of 2D 1H–15N HSQC spectra of Gp44NT-His with and without dsDNA. Black: no dsDNA; Blue: 0.5 equivalent of dsDNA added and Red: 1 equivalent of dsDNA added. Spectra recorded at pH 6.5, 298K. Right: Overlay of 2D 1H–15N HSQC spectra of His-Gp441– 55 with and without dsDNA. Black: no dsDNA and Red: 1 equivalent of dsDNA added. Spectra recorded at pH 6.5, 298K. (E) A model of Gp44NT/dsDNA interaction created by using Xis/DNA complex structure (PDB ID: 2IEF). Peaks experience most chemical shift perturbation is highlighted in red.

