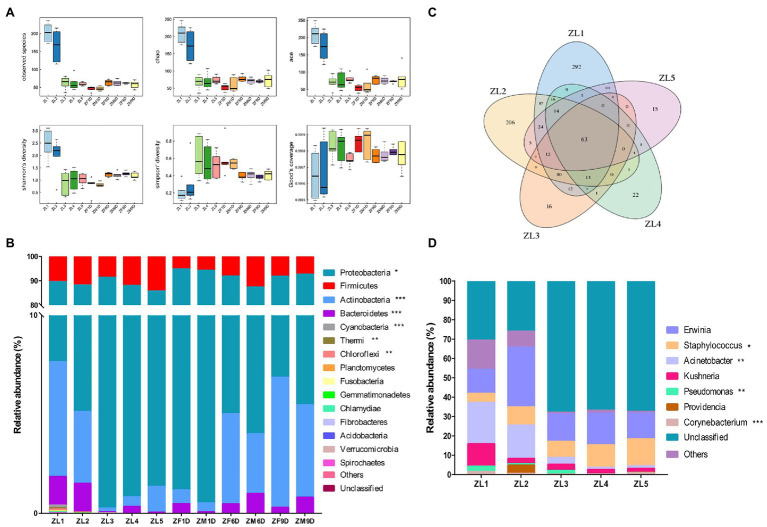
Figure 1.
Bacterial community dynamics among different developmental stages in Adelphocoris suturalis. (A) Boxplot of α-diversity measured by the six indexs. (B) Relative abundance of bacteria communities at the phylum level in different groups. (C) Venn diagram showing operational taxonomic unit (OTU) classification in nymphal period. (D) Relative abundance of bacteria communities at the genus level in nymph stages. (Bacteria with relative abundance lower than 0.5% in all samples were all merged into others. Kruskal-Wallis test, *0.01 < p ≤ 0.05, **0.001 < p ≤ 0.01, and ***p ≤ 0.001).

