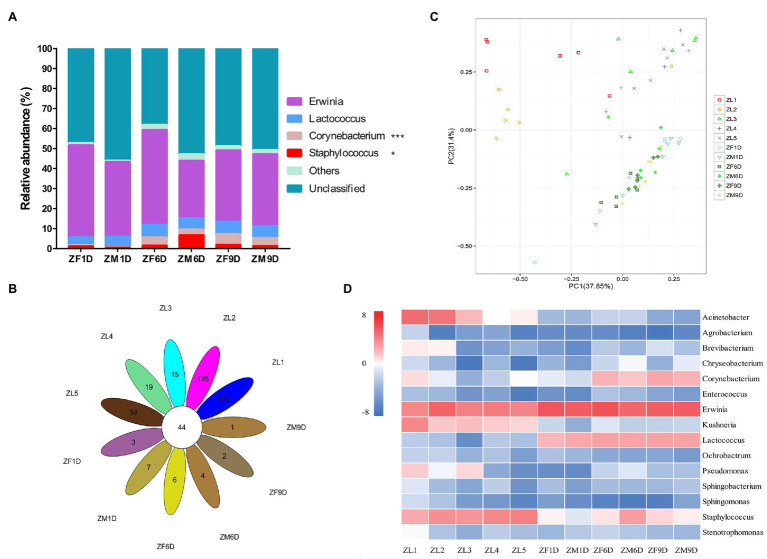
Figure 2.
Bacterial community dynamics among different developmental stages in A. suturalis. (A) Relative abundance of bacteria communities at the genus level in adult stages. (B) Core-Pan OTU presents the common and unique OTU of all samples in petal diagram. (C) Difference of OTU types in different developmental stages based on Principal Components Analysis (PCA). (D) Heat map analysis of the top 15 microbial populations with relative abundance at different developmental stages. The data represented by color in the figure is represented by log2(relative abundance). Bacteria with relative abundance lower than 0.5% in all samples were all merged into others (Kruskal-Wallis test, *0.01 < p ≤ 0.05 and ***p ≤ 0.001).

