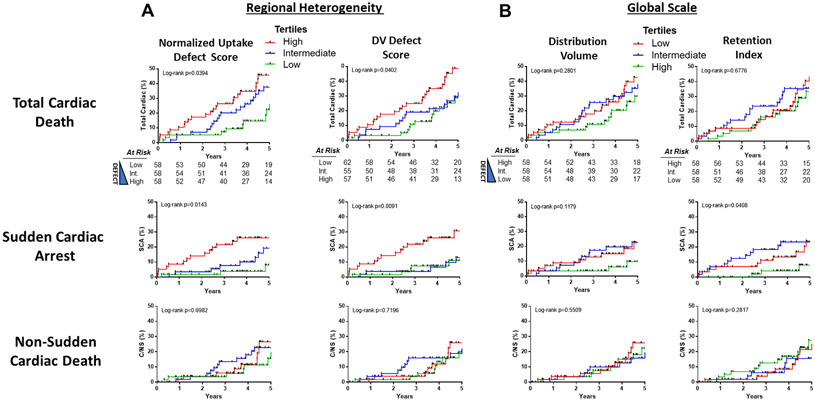
Figure 4.

Kaplan-Meier curves show the incidence of cardiac endpoints for tertiles of regional heterogeneity (A) and global scale (B) [11C]HED quantification methods. Note that the coloring of the tertiles for the global scale parameters (B) is reversed to correspond with the theoretical risk. For the regional defect parameters, the low (green) and high (red) tertiles for Regional Normalized Uptake Defect Score (low: <22.87%, high ≥32.6%) and DV Defect Score (low: <35%, high ≥43%) are shown. Similarly, for the global scale parameters, the low (red) and high (green) tertiles for DV (Low: <8.7mL/g, High: ≥12.2 mL/g) and RI (Low: <3.84 %/min, High: ≥4.85%/min). Corresponding P values for the univariate analysis using continuous variables are in Table 3. SCA, sudden cardiac arrest; C/NS, non-sudden cardiac death.
