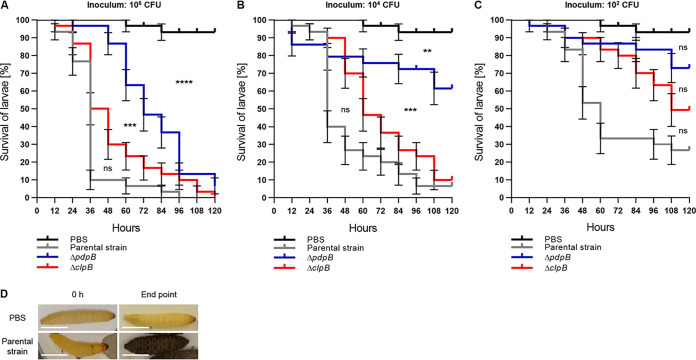
FIG 2.
F. tularensis subsp. novicida kills G. mellonella larvae in a T6SS- and concentration-dependent manner. (A to C) Survival curves represent three individual experiments over 5 days pooled together (n0 total = 30; n0 = 10 per experiment). State of G. mellonella larvae was monitored every 12 h. Pupating larvae were censored (vertical dashes). Error bars indicate standard error. Black survival curves, PBS-treated G. mellonella larvae; gray survival curves, G. mellonella infected with F. tularensis subsp. novicida U112 iglA-sfGFP (parental strain); blue survival curves, G. mellonella larvae infected with F. tularensis subsp. novicida U112 iglA-sfGFP ΔpdpB strain (T6SS-negative control); red survival curves, G. mellonella infected with F. tularensis subsp. novicida U112 iglA-sfGFP ΔclpB strain. Individual curves were compared with log rank (Mantel-Cox) test. P values above a Bonferroni-corrected threshold were considered nonsignificant (ns). **, P < 0.01; ***, P < 0.001; ****, P < 0.0001. Following curves were compared. Parental strain versus ΔclpB mutant, ΔclpB mutant versus ΔpdpB mutant, and ΔpdpB mutant versus PBS control. Calculated infection inocula are as follows: 106 CFU (A), 104 CFU (B), and 102 CFU (C). (D) Representative examples of G. mellonella larvae morphology directly after PBS treatment and infection with F. tularensis subsp. novicida U112 iglA-sfGFP (parental strain) at an infection dose of 104 CFU and after 120 h or 96 h, respectively.

