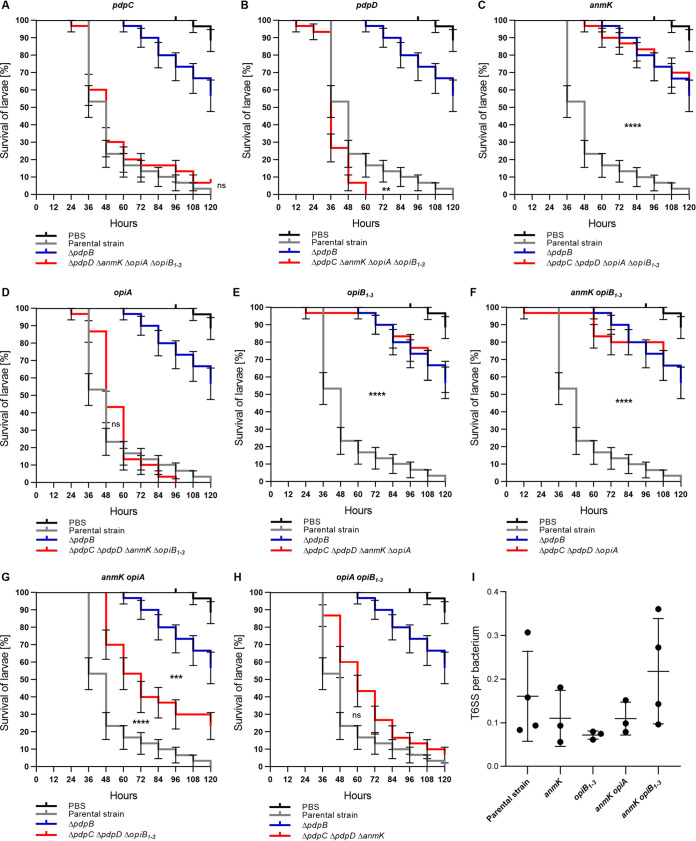
FIG 4.
PdpC, PdpD, and OpiA are sufficient for T6SS-dependent Francisella virulence in G. mellonella. Survival curves represent three individual experiments over 5 days pooled together (n0 total = 30; n0 = 10 per experiment). State of G. mellonella larvae was monitored every 12 h. Pupating larvae were censored (vertical dashes). Error bars indicate standard error. Individual curves were compared with log rank (Mantel-Cox) test. P values above a Bonferroni-corrected threshold were considered nonsignificant (ns). **, P < 0.01; ***, P < 0.001; ****, P < 0.0001. Parental strain versus mutant curves were compared to each other. For panel G, mutant versus ΔpdpB strain curve was also compared. Black survival curves, PBS-treated G. mellonella larvae; gray survival curves, G. mellonella infected with F. tularensis subsp. novicida U112 iglA-sfGFP (parental strain); blue survival curves, G. mellonella larvae infected with F. tularensis subsp. novicida U112 iglA-sfGFP ΔpdpB strain (T6SS-negative control); red survival curves, G. mellonella infected with F. tularensis subsp. novicida U112 iglA-sfGFP ΔpdpD ΔanmK ΔopiA ΔopiB1–3 mutant (pdpC) (A), ΔpdpC ΔanmK ΔopiA ΔopiB1–3 mutant (pdpD) (B), ΔpdpC ΔpdpD ΔopiA ΔopiB1–3 mutant (anmK) (C), ΔpdpC ΔpdpD ΔanmK ΔopiB1–3 mutant (opiA) (D), ΔpdpC ΔpdpD ΔanmK ΔopiA mutant (opiB1–3) (E), ΔpdpC ΔpdpD ΔopiA mutant (anmK opiB1–3) (F), ΔpdpC ΔpdpD ΔopiB1–3 mutant (anmK opiA) (G), and ΔpdpC ΔpdpD ΔanmK mutant (opiA opiB1–3) (H). (I) Quantification of T6SS sheaths per bacterium within 5 min for F. tularensis subsp. novicida U112 iglA-sfGFP (parental strain), ΔpdpC ΔpdpD ΔopiA ΔopiB1–3 mutant (anmK), ΔpdpC ΔpdpD ΔanmK ΔopiA mutant (opiB1–3), ΔpdpC ΔpdpD ΔopiB1–3 mutant (anmK opiA), and ΔpdpC ΔpdpD ΔopiA mutant (anmK opiB1–3). At least three biological replicates with at least 3,200 bacteria each were analyzed per strain. Mean with standard deviation is shown. No significant differences in means were detected with Tukey’s multiple-comparison test and 95% confidence level.

